
Influence of Tree, Stand, and Site Attributes on Hardwood Product Yield: Insights into the Acadian Forests

1
Department of Wood and Forest Sciences, Université Laval, 2405 rue de la Terrasse, Québec, QC G1V 0A6, Canada
2
Canadian Wood Fibre Centre, Natural Resources Canada, 1055 Rue du Peps, Québec, QC G1V 4C7, Canada
*
Author to whom correspondence should be addressed.
Forests 2023, 14(2), 182; https://doi.org/10.3390/f14020182
Submission received: 16 December 2022
/
Revised: 11 January 2023
/
Accepted: 14 January 2023
/
Published: 18 January 2023
(This article belongs to the Special Issue Recent Advances in Wood Harvesting, Timber Logistics and Road Planning)
Abstract
:Acadian forests of New Brunswick, Canada, are highly variable both in terms of species composition and quality. This is particularly accurate for hardwoods, for which value recovery is closely influenced by wood quality and a proper understanding of tree attributes. Therefore, based on several databases created between 2012 and 2021, the objectives of this study were to (1) characterize the stand-level distribution of species, size, form, and risk according to site factors and (2) determine the influence of different tree, stand, and site factors on the recovery of merchantable, sawlog, and veneer volumes. In total, 287,984 trees stemming from 9233 plots were analyzed for objective 1. For a subset of trees (743), tree, stand, and site attributes were also related to the product output of harvesting operations through a comprehensive inventory of standing trees and their associated products. Analyses were performed with linear and multinomial logistic regressions as well as factor analysis of mixed data (FAMD). Key results indicated that tree attributes and product recovery were significantly influenced by (1) environmental factors (soil, temperature, and precipitation), summarized by ecoregion in this study and (2) tree size and form. These findings suggest that the inclusion of site factors in supply planning could improve product recovery during forest operations.
1. Introduction
Hardwoods and softwoods differ at microscopic and macroscopic levels [1,2]. Hardwood trees have more complex architectures [3] and are usually transformed into a wider range of commodities, including higher-value products such as flooring, cabinets, veneer or furniture, and lower-value ones such as papers, cellulosic fibers, and pallets [4,5,6], whereas softwoods are mainly used for construction lumber, pulp and paper, or biomass [7]. The intricate architecture of hardwood trees and the greater diversity of log grades can often lead to additional difficulties in the bucking phase, the task of cross-cutting a stem into several assortments [8]. During mechanized harvesting operations, complexity of stand and wood architecture can require higher cognitive efforts and lead to the quicker fatigue of operators as compared to operations performed in monospecific softwood stands [9].
The creation of wood products is influenced by tree size (dimensions, form, straightness, etc.) and wood quality factors (wood density, growth rate uniformity, presence of knots, chemical composition, fungus-caused coloration, etc.) [2], which in turn may be influenced by silviculture [10] and the inter- and intra-species genetic diversity [2]. Variation of these attributes influence the monetary value of trees [11]. This is especially applicable for hardwoods since their product specifications are particularly sensitive to quality aspects. The price of good quality timber can be several folds higher than lower quality timber [12].
Tolerant northern hardwoods, which include species from the genus Acer, Betula, Fagus, and Quercus, are a significant component of forest ecosystems and value chains of Eastern Canada and Northeastern United States: in Canada, they cumulate 6.5 million hectares in the Atlantic Maritime and Mixedwood Plains ecotones [13], while in the United States they cover approximatively 8 million hectares [14]. Sugar maple (Acer saccharum L.) is one of the most common hardwood species found in Acadian forests [15], which cover the Maritime provinces of Canada (New Brunswick, Nova Scotia, and Prince Edward Island) [16] and parts of the United States, particularly in the state of Maine [17]. In the Acadian forests of New Brunswick, the forest industry sector directly employed over 10,000 people in 2020 [18] and, in 2021, 9,681,427 m³ of roundwood were harvested, from which 34% were hardwoods used domestically and for imports [19].
Volume recovery of sugar maple and yellow birch (Betula alleghaniensis Britton) in the province of Québec, Canada, was investigated by Fortin et al. [20] according to different tree quality classification systems. The predicting factors in this study were limited to DBH, standing tree classification, and tree species. The positive effect of DBH and tree quality class on monetary output of sugar maple products was also analyzed by Cockwell and Caspersen [11], as sawlog volume output increased with tree size. More recently, Havreljuk et al. [6] studied the relation between log and lumber attributes for sugar maple and yellow birch, and highlighted the need of including log attributes in models assessing volume and value recovery.
Castle et al. [21] predicted the probability for single trees of belonging to certain quality and risk groups, along with the sawlog recovery for sugar maple, yellow birch, red maple (Acer rubrum L.), and red oak (Quercus rubra L.) in Acadian forests. The logistic models were based on tree species, DBH, and the quality of trees as well as environmental variables such as climate index, topographic index, elevation, slope, aspect, and drainage, both in the United States and Canada, on 5397 trees with a DBH larger than 24 cm with both site and plot as random effects. The best model to predict the probability of belonging to a quality or risk class reached 59%–67% of accuracy depending on the considered class, with only species and DBH as predictors, with a significant contribution of the random effects. Tree quality and risk classes significantly contributed to predict the occurrence of sawlogs (AUC = 0.83) and the sawlog/merchantable volume ratio with, however, a low coefficient of determination (R2 = 0.34). The prediction of the sawlog ratio was greatly improved by replacing the tree quality class in the predictors by the estimated merchantable sawlog length potential, a continuous variable (R2 = 0.88). This study also concluded that environmental variables did not have a significant contribution to sawlog recovery. This contradicts the results of Hassegawa et al. [22] and Guillemette and Bédard [23], who observed that environmental factors had the most influence on sawlog and veneer recovery in the province of Québec. These varying conclusions may be an artifact caused by multicollinearity in the predicting variables [24], a problem for parametric methods such as general linear models as used in Castle et al. [21] and in Guillemette and Bédard [23], but not for multivariate analysis methods or for boosted regression tree methods utilized in Hassegawa et al. [22].
To expand upon existing studies on the characterization of hardwood production at the tree level, we propose to include stand and site attributes to analyze and describe the structure of Acadian forest stands focusing on key factors previously related to product recovery in order to provide a snapshot of the current conditions of hardwood forests of New Brunswick. This paper will also attempt to establish relationships between tree, stand, and site attributes while (1) using an extensive dataset, (2) combining multiple data sources using multivariate analyses, and (3) examining the possible contribution of other environmental factors.
Specific objectives are to (1) characterize the stand-level distribution of tree species, size (diameter and height), form and risk, considering the influence of the proportion of hardwoods in the stands (dominance), stand density (expressed by the relative stand density index RSDI), the ecoregion and the sampling strategy of each data source (sample type) and (2) determine the influence of different tree, stand, and site factors on the merchantable volume and the proportion of sawlog assessed throughout the Acadian forests of New Brunswick.
2. Materials and Methods
2.1. Study Area
Climate in the Acadian forests of the province of New Brunswick, Canada, is described as wet and temperate but highly variable over the province. Altitude ranges from sea level to 820 m and geology is heterogeneous due to different geneses such as tectonic shift, volcanism or influence of recurrent glaciation [15]. These biophysical variations are contributing to the diversity of Acadian forests, which are constituted by 20 commercial tree species [4]. New Brunswick has a total area of 73,440 km² [25] and a forest cover of 83% [26]. This forest area is almost evenly divided into public and private forests [4], the latter being primarily managed by large free-hold companies [27]. Public forests are commonly referred to as “Crown Land” and are managed by the New Brunswick Department of Natural Resources and Energy Development (NBDNRED).
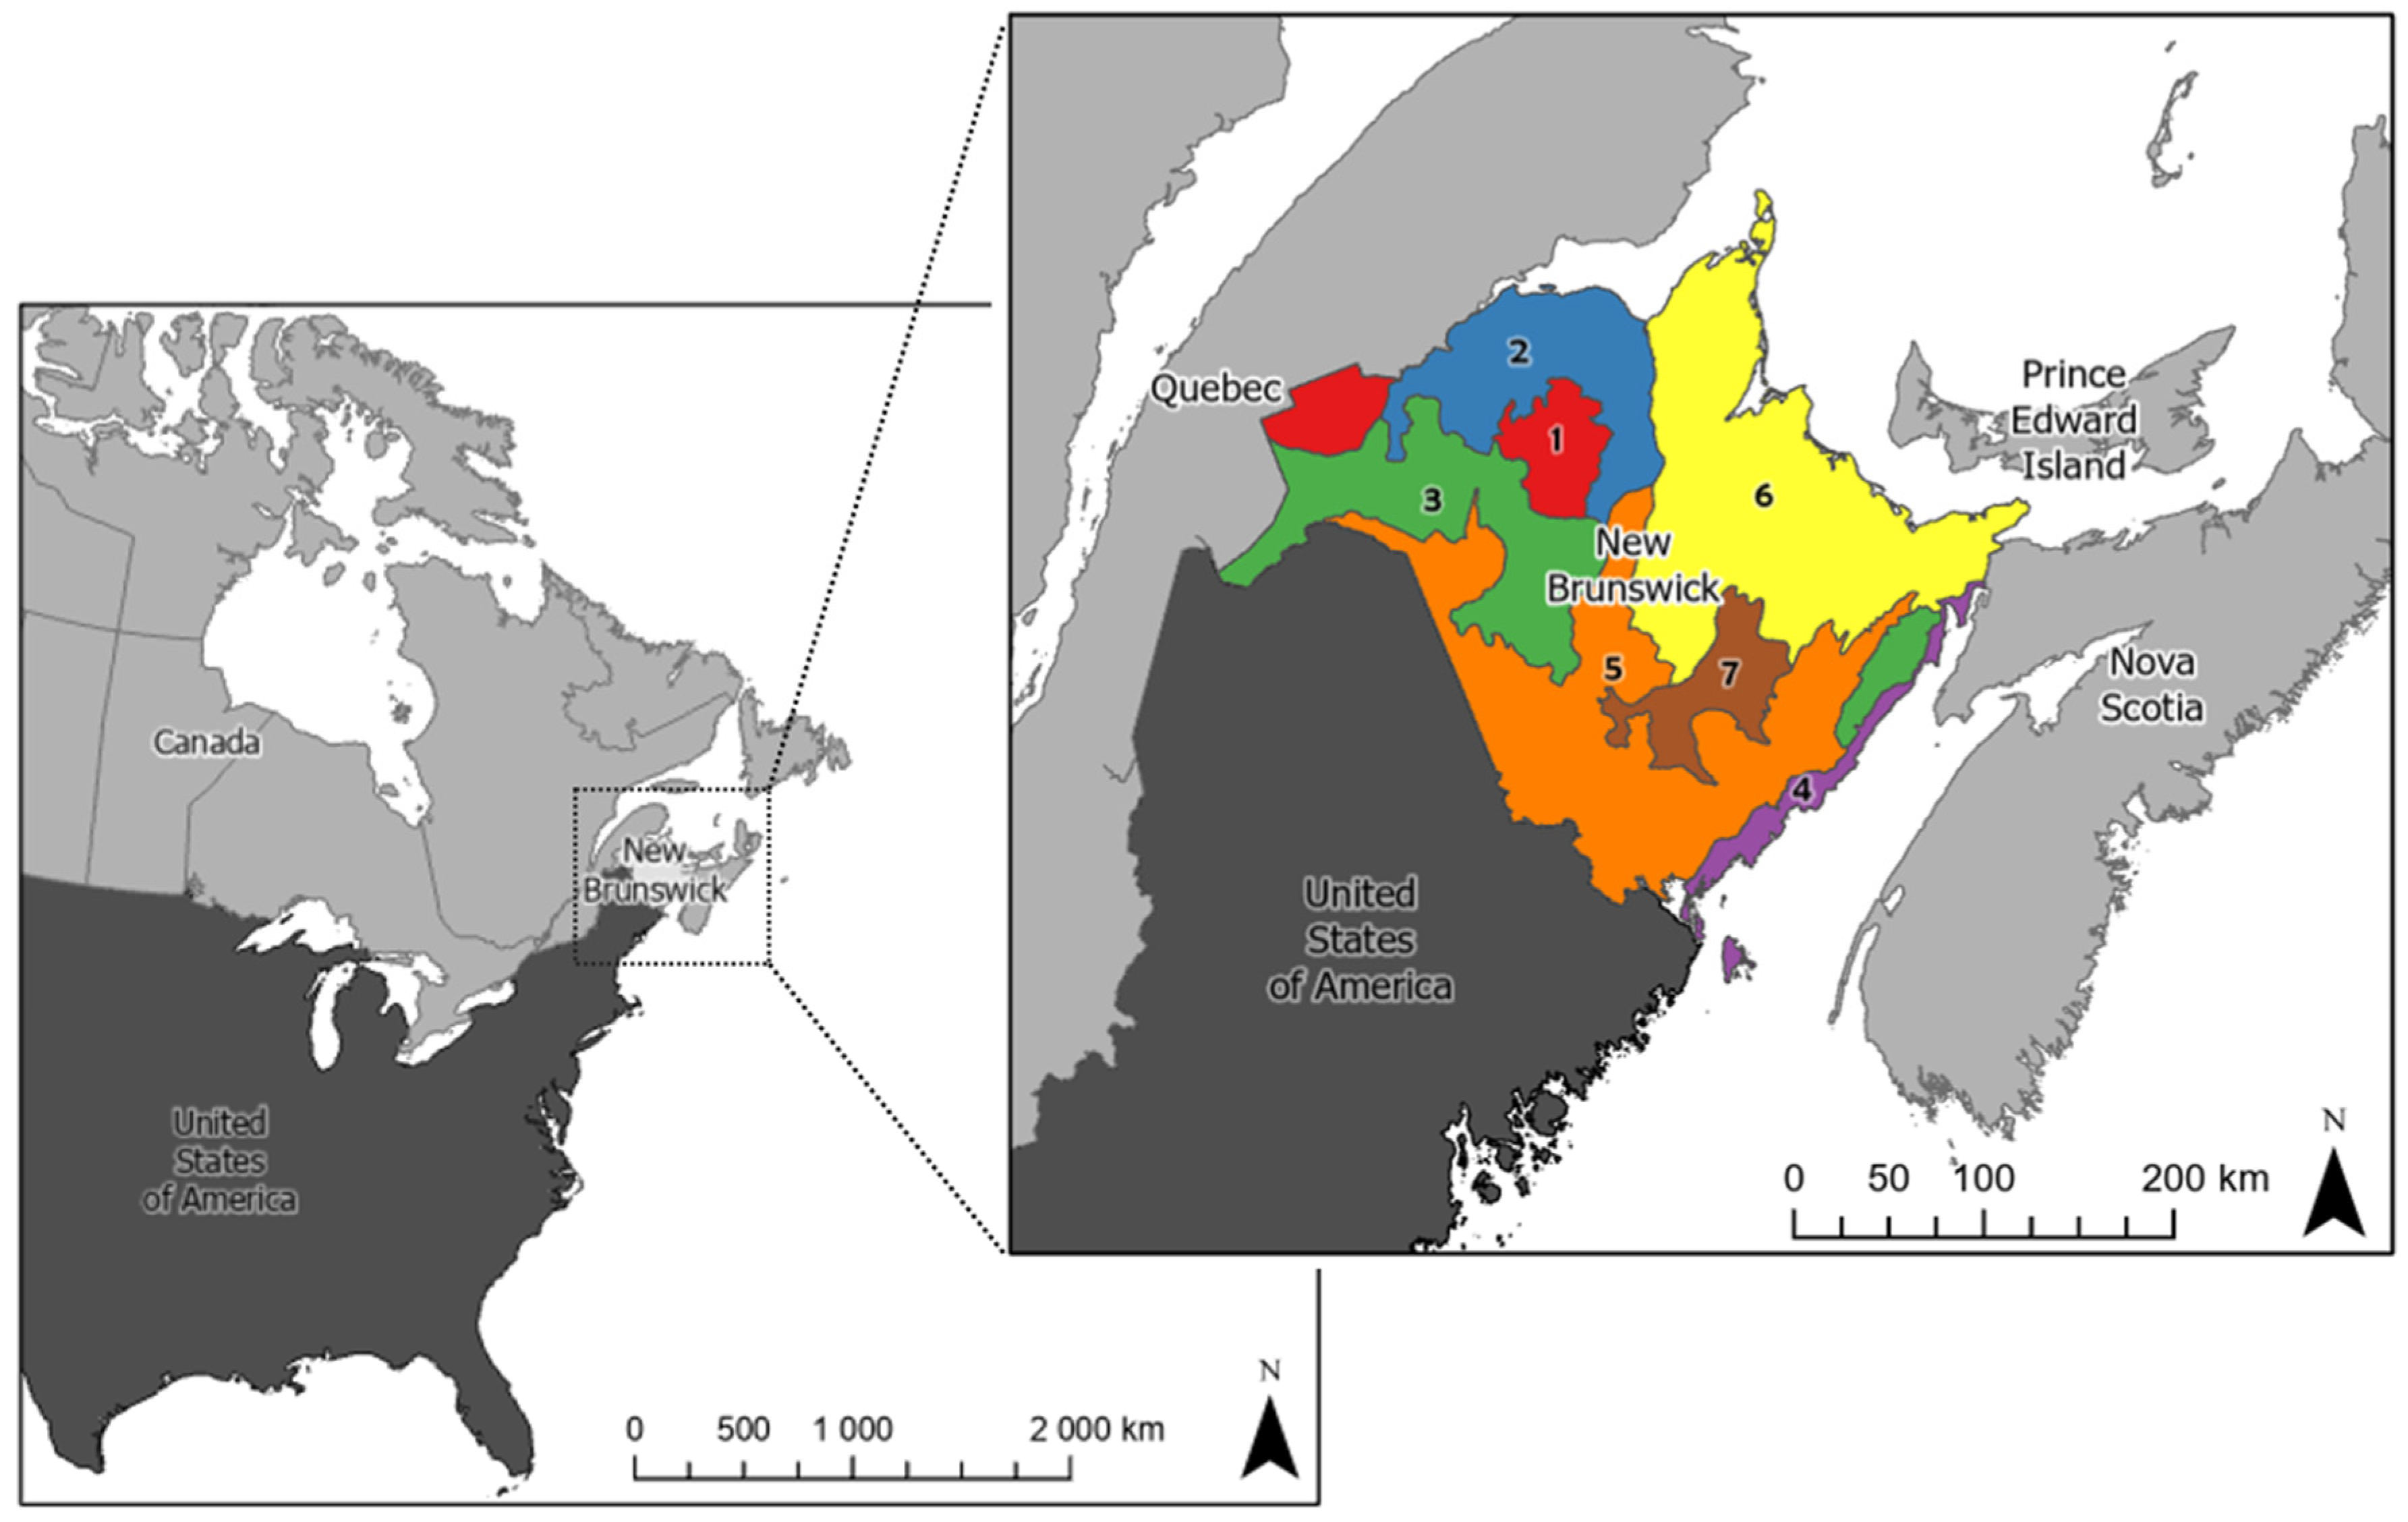
The province is divided into seven ecoregions, mainly defined as a combination of topographic, climatic, geological, and pedologic features [28] (Figure 1). Forest operations are primarily performed by cut-to-length (CTL) single-grip harvesters that fell and process trees directly in the forest [29].
2.2. Data Collection
2.2.1. Data Sources
Data were provided by five different sources originating from two organizations (Northern Hardwoods Research Institute (NHRI) and the NBDNRED) and collected between 2012 and 2021 (Table 1). All data sources are based on the assessment of attributes of standing and living trees. Sample trees were felled and bucked in three of the five data sources, thus allowing the measurement and characterization of products. Two of these bucking databases (labeled “D” and “P”) contain only trees and products bucked in the CTL method, while in one study, trees were either processed in CTL, or cut in full tree and then processed by a slasher. This study was subset into two parts and labeled either “M.CTL” or “M.FT”.
2.2.2. Sampling Methods
The five different data sources were designed for distinct purposes. Three were planned for the characterization of the hardwood resource, one for the monitoring of growth and yield at the scale of the province, whereas the last one is composed of a collection of scientific studies on hardwood silviculture and inventory methods. The provincial growth monitoring study (labeled “C”) was conducted systematically on a 2 km grid over the forest land of the province, whereas the other studies were more targeted toward mature stands. Two databases (“D” and “P”) were established in forest stands that were about to be harvested, assessing plots within a systematic grid in each stand. Otherwise, plots were randomly distributed as single plot or groups. To consider this variation in terms of targeted populations by each study, sample plots were classified in two sample types labeled as “syst” or “other”. Sample plots were circular and either used a fixed or variable radius. The size of the plots and the factor of the prism used differed depending on the inventory. Fixed radius plots ranged from 400 to 10,000 m2, whereas variable radius plots used basal area factors from 1 to 3 m2/ha. Bias caused by different sizes of plots [30] was considered not substantial [31].
2.2.3. Basic and Complementary Measures on Trees
Within each plot, all merchantable trees (with diameter at breast height (DBH) > 9 cm) were assessed for species and their DBH (cm) was measured. Depending on the design of each study, additional information on all trees or a subsample of trees was measured. Specifically, form and risk classes as well as the crown class were assessed and total height (m), height of the living crown (m), and height of the fork (if present, m) were measured (see Table 2).
In New Brunswick, the form and risk of a tree are classified according to classes evaluating the five first meters of each stem. This classification system was introduced in 2012 and is based on external signs that are assumed to have an impact on the internal health of a stem. One of the pivotal factors for the risk classification is the presence of significant forks [32]. There are eight form classes (F1-F8) (see Figure S1) and four risk classes (R1-R4) (see Table 3). These form and risk classes were designed to be the base for silvicultural decisions, be easily identifiable in the field, and take into account the evolution of trees [32].
2.2.4. Measures on Products
Three of the five databases (“D”, “M” and “P”) contained information about log products resulting from the bucking of a subsample of trees, in both the main stem and the large branches. The tree species considered were sugar maple, red maple, white birch, and yellow birch and in addition other hardwoods. Large branches were defined as having a diameter larger than one third of the diameter of the main stem at the branch insertion point [33]. Products were classified during inventory according to the respective protocols and company specifications. Small- and large-end diameters (outside bark) were measured for each log, along with its length (in cm). Additionally, inside bark diameters were measured for logs from one of three studies (“D”). Due to the different protocols of the three studies bearing product information, the number of observations differed in the analyses (Table 2).
2.2.5. Environmental Variables
Environmental data were available for 6789 (74%) of the plots. As environmental data are assumed to have an impact on tree characteristics, two subsets were built: one with all plots (N = 9233), the other containing only plots with geographic coordinates (N = 6789). Due to data availability, climate data, topographic information, and soil information for the analysis of ecoregions were available for a subset of 5954 plots. Certain climate data were extracted from the Google Earth Engine, using the fourth version of the Daymet database [34]. Other climatic variables were downloaded from the Canadian Forest Service website (Table 4). Enhanced Forest Inventory (EFI) data, produced between 2015 and 2018, and wet area mapping (WAM) were provided by the NBDNRED. The WAM is a raster of the province of New Brunswick indicating the wetness of the soil, which forecasts different depth-to-water classes [35]. Possible drought was addressed using the Palmer Drought Severity Index (PDSI) [36].
2.3. Data Processing
2.3.1. Cleaning and Filtering
Trees were included when their DBH was more than 9 cm and trees with a DBH larger than 200 cm were omitted considering the typical radial growth in this region [37]. Trees inventoried in regeneration plots (smaller than 50 m²) were also removed. As the NHRI form and risk classification was introduced in 2012, only trees inventoried after the introduction of this classification system were used for analysis. Plots from one study (“C”) measured before 2019 were excluded because of inconsistencies in the evaluation of form and risk classes, thus providing a total of 287,984 trees for analysis once all filters were applied.
2.3.2. Computations
During data preparation, variables were grouped together to improve clarity. For example, the 30 tree species were clustered into four species and two groups of species: red maple (RM), sugar maple (SM), white birch (Betula papyrifera, WB), yellow birch (YB), other hardwoods (labeled as “oh”), and softwoods (labeled “sw”). Classes of form were grouped together in four form categories to increase readability of analysis and address the unequal weight between form classes (Table 5, grouping inspired by [21]).
The basal area, stem density, and quadratic mean diameter of every plot were calculated using standard procedure. Plot dominance was also determined and categorized as hardwood dominated (“hw.dom”) when the basal area of hardwoods was at least 50% of the total basal area. Otherwise, plots were labeled as “sw.dom”.
The stand density of plots was expressed using the relative stand density index proposed by [30]. The RSDI adapts Reineke’s stand density index to mixed stands in northeast America, since the latter was developed for a type of forest stand, which is not comparable to hardwood-dominated stands in Acadian forests [38]. The RSDI is calculated using specific gravity of trees; for this study, air dry wood with a moisture of 12% [39] was chosen. For each tree, this specific gravity is related to a mean diameter of 25 cm [30].
To ensure product homogeneity, three groups of log products were built: veneer and sawlogs (hereafter abbreviated veneer.saw), pulp, and unutilized products (hereafter abbreviated unut). Products were obtained in three field campaigns. As the product classification in one database varied depending on the treatment, this database was subset into “CTL” and “full tree”, labeled “FT”. A total of 3712 products were generated.
The volume of each product bucked was calculated using the Smalian formula [40] and grouped in three product classes: (1) sawlogs and veneer, (2) pulp and (3) unutilized volume (wood that was wasted, rotten or not usable as a product). Volume of sawlog, veneer, and pulp was considered as merchantable. As some diameters measured inside bark in the field were not measured, missing values were imputed by BagImpute from the caret package [41] in R. To compare product volumes generated per tree, percentages of the three product classes were calculated and performance classes (low, medium, high) were built using the 33rd, 67th, and 100th percentiles.
2.4. Statistical Analysis
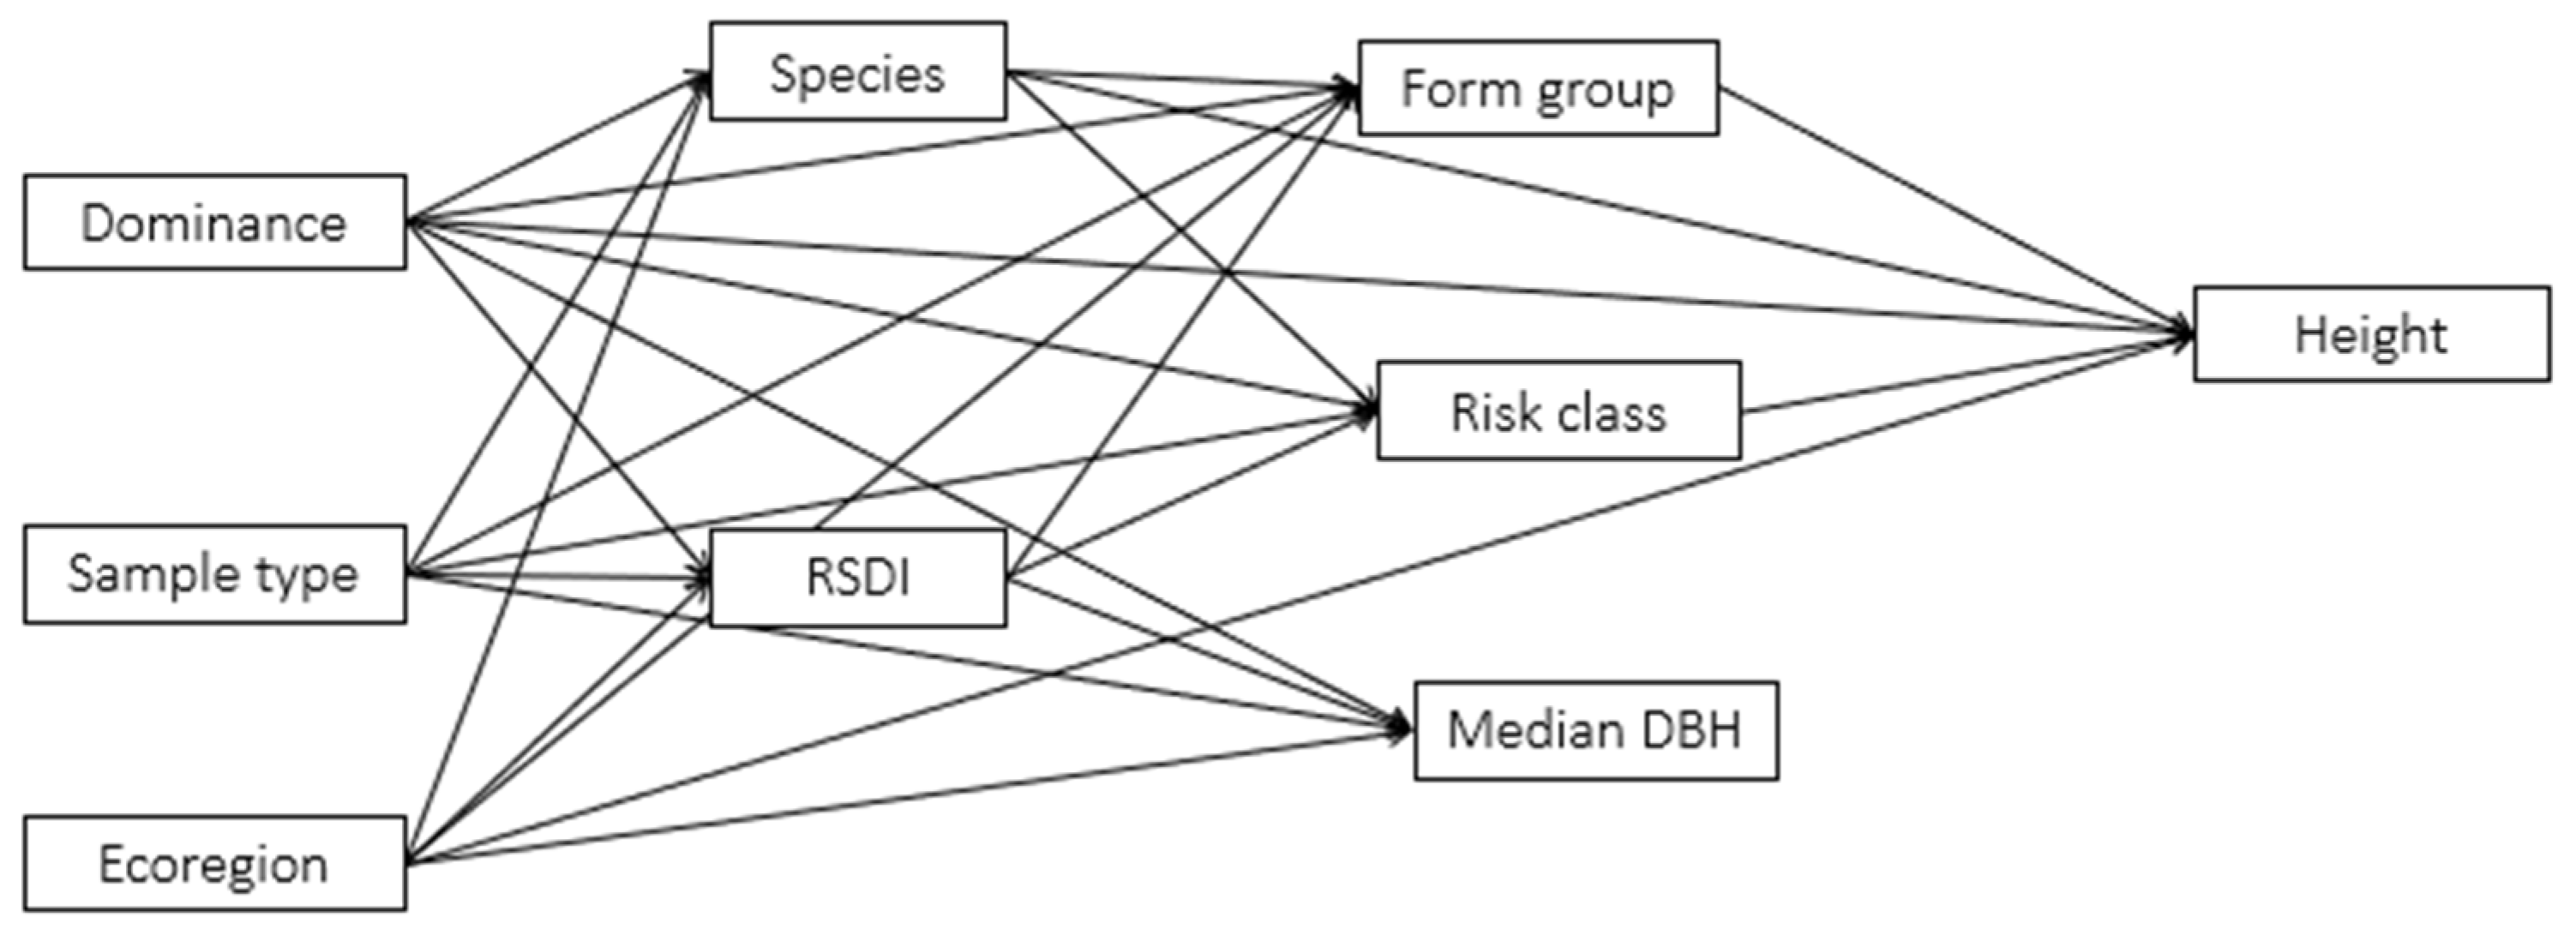
Analysis was conducted either at the plot or tree levels based on a hypothetical network of causality between the predicted variable and the predictors (Figure 2). Plot-level analyses were conducted with the analysis of variance (ANOVA) after fitting a general linear model for quantitative predicted variables and multinomial logistic regressions for nominal (class) variables. When making a multinomial logistic regression, an ANOVA of type II was conducted with the model to see if the variables had a significant influence or not on the response variable. For all analysis, only first-order interactions were considered, and the significance level was set at p < 0.05.
In Figure 2, each arrow represents a variable included in the analysis. The description of products and the analysis of environmental data were, respectively, conducted with ANOVAs with Tukey post hoc test, and factor analysis of mixed data (FAMD). The FAMD allows the analyses for both quantitative and qualitative variables and was conducted using the Factoshiny package in R [42]. In this analysis, the focus is placed on the relationship between site, stand, and tree variables with alternatively the ratio of merchantable volume over the total tree volume, and the ratio of sawlog and veneer volume over the total volume. These two yield variables were first transformed in classes (high, medium, and low) based on percentile thresholds. The resulting categorical variables were then considered as supplemental variables, and not used to calculate the principal components [43].
3. Results
3.1. Characterization of Ecoregions with Environmental Factors
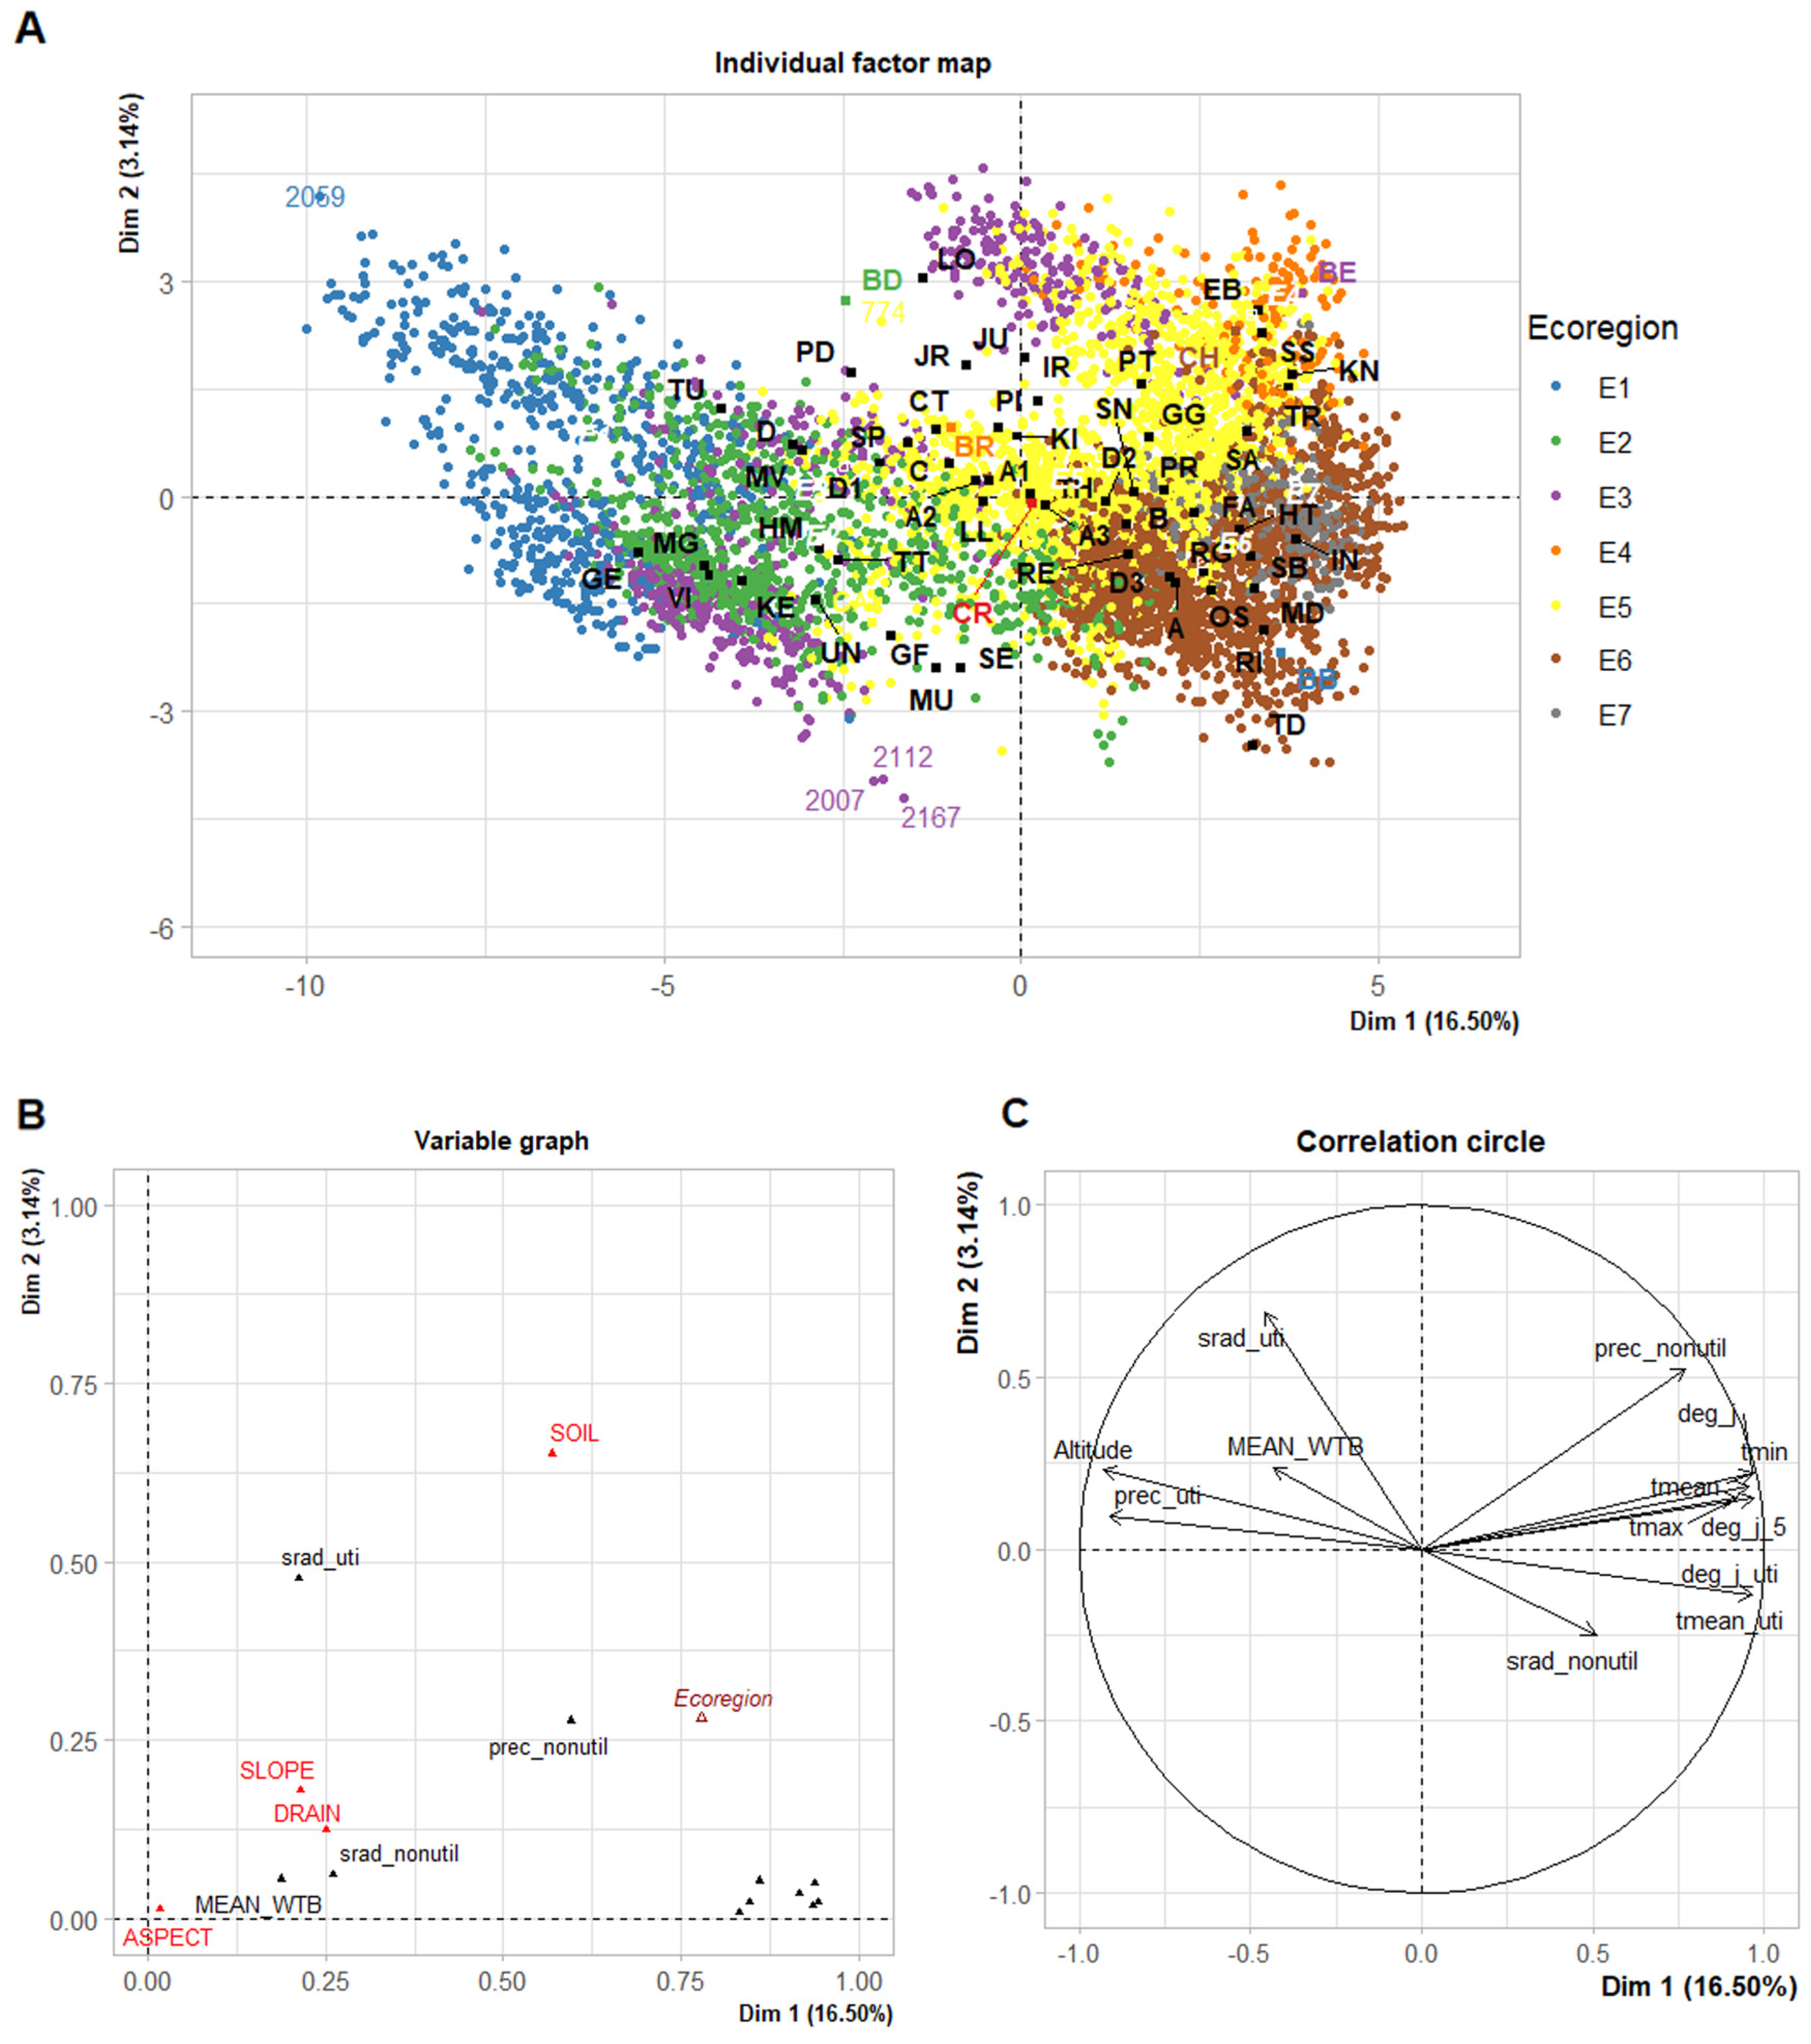
The 5954 plots were located throughout the province in altitudes ranging from 1 m to 740 m and with mean annual temperatures varying between −3.3 °C and 2.0 °C with a median mean temperature of −0.3 °C. In total, 19 environmental variables were included into the FAMD (Table S1). The percentage of explained variance reached 90% when considering 49 dimensions. The first dimension explained 16.5% of the variance while the second explained 3.1%. Therefore, only these two dimensions were considered. The analysis of the eigenvalues indicated that the two first dimensions were strongly influenced by variables related with temperature (annual mean temperature, mean temperature during growing season, etc.) as well as with altitude. The influence of wet area mapping was rather small in both dimensions. Shortwave radiation during growing season had a subtle influence on the first dimension but was the variable having the greatest influence on the second dimension. The contributions of drainage, aspect, and slope to dimensions 1 and 2 were weak and therefore did not seem to influence the building of ecoregions (Figure 3B). Even though single soil classes did not strongly affect the two dimensions, soil classes had a correlation of 56% with the first dimension and 65% with the second dimension.
Ecoregions 1, 2, 3, 6, and 7 were very well represented by the first dimension. The explanation of ecoregions with second dimension was poor, though ecoregions 4, 5, and 6 were better represented than the other four ecoregions. Ecoregions 1, 2, and 3 tended to be in regions with higher altitude, more precipitation in the growing season as compared to ecoregions 4, 5, 6, and 7. These four ecoregions (4, 5, 6 and 7) tended to have a higher temperature range, higher mean annual temperatures, as well as higher mean temperatures during growing season. These differences observed between ecoregions supported the use of ecoregions as a legitimate simplification of environmental data to characterize plots on a provincial scale (Figure 3A,C).
3.2. Plot Characterization
3.2.1. Species Composition
The 287,984 trees inventoried in the 9142 plots were comprised of 30 different species, 63% of which were softwood species and the remaining 37% hardwood species. In the group of softwood species, balsam fir (Abies balsamea) dominated with an overall share of 33%, followed by black spruce (Picea mariana) with 11% and red spruce (Picea rubens) with 8%. Red maple was the most common hardwood species, representing 9% of all trees, followed by sugar maple (7%), white birch (6%), and yellow birch (5%). The remaining species composition was for other hardwood (9%).
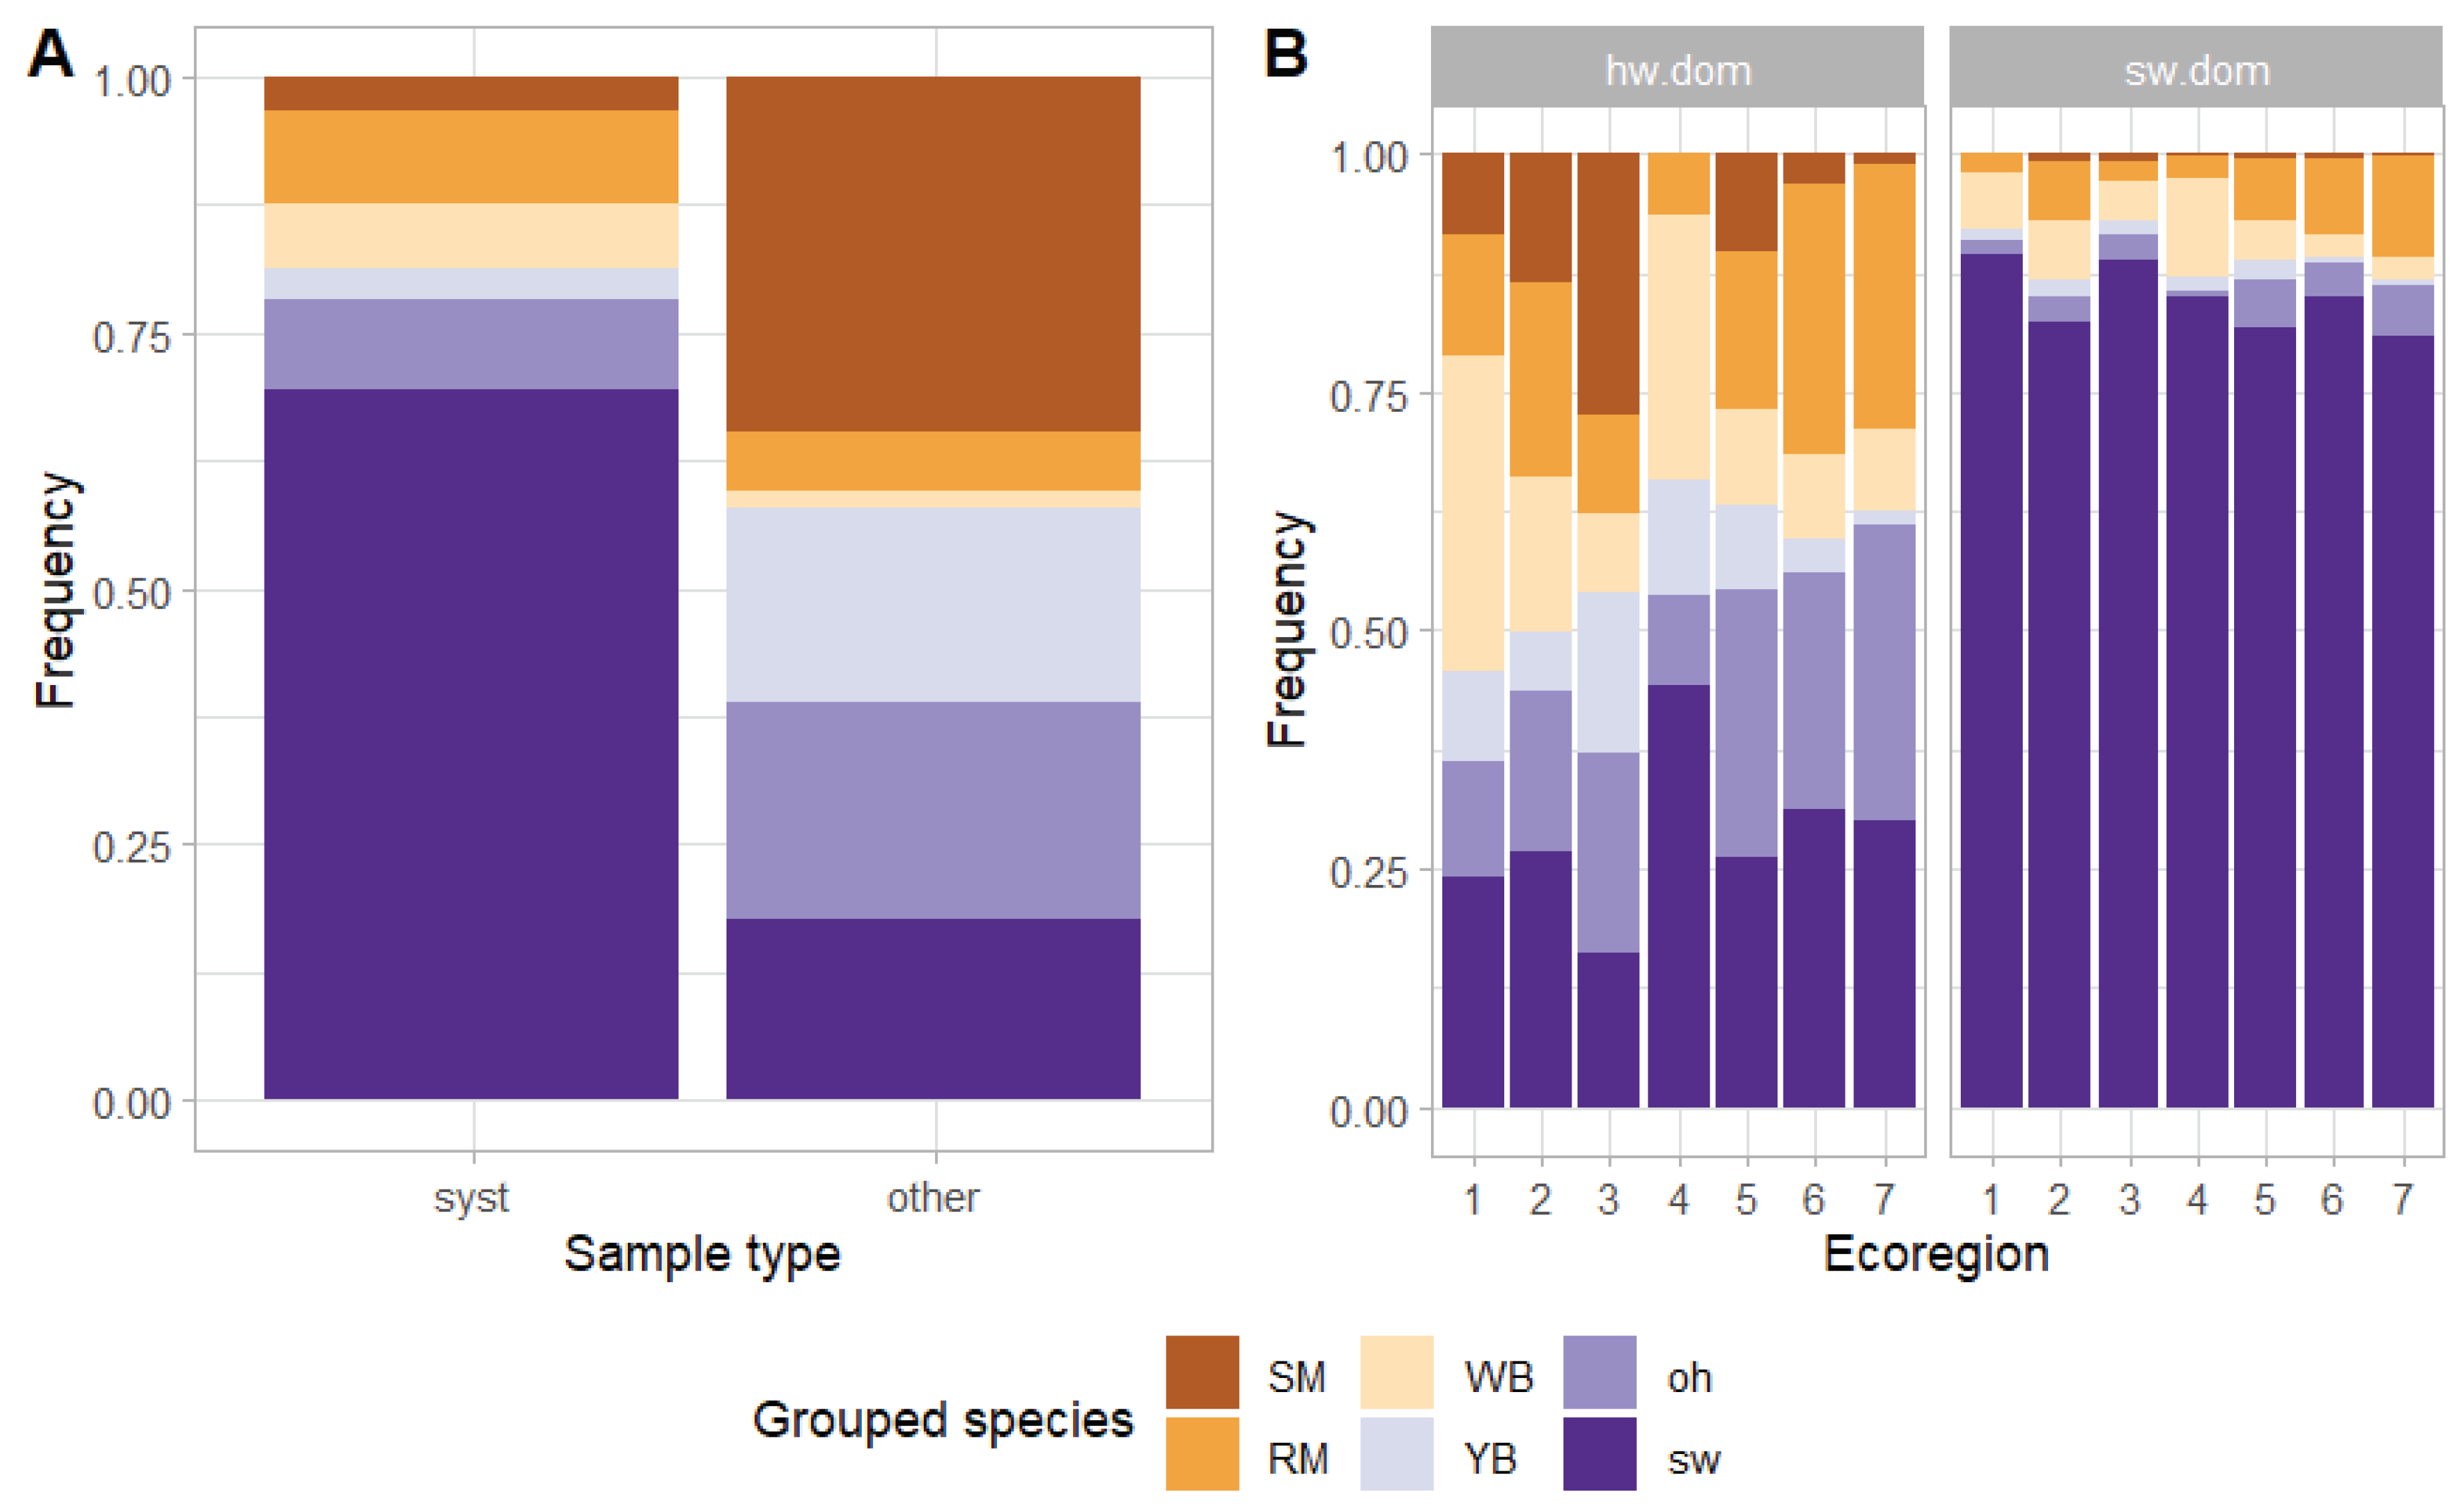
When considering the 6789 plots with 253,235 trees inventoried with geographical information, a significant influence of the dominance of the plot, the ecoregion, and the sample type on tree species distribution was observed (multinomial logistic regression, ANOVA; Table S2: ANOVA table (type II) for multinomial analysis of tree species. The differences in distribution amongst the plots selected in a systematic method and those selected in another method were noticeable for all six species groups (Figure 4A). In the plots selected in a systematic method, softwoods represented 69% of the tree species, whereas they only had a share of 18% in the other plots. As expected, all hardwood species except red maple were observed more frequently in other plots than in the plots selected in a systematic method. Beside the softwoods, the largest difference was associated with sugar maple with a share of 3% in systematically selected plots as opposed to 37% in the plots selected with another method.
Species composition was also significantly influenced by the interaction of plot dominance and ecoregion (Figure 4B). In the softwood-dominated plots, the occurrence of hardwood species varied between 11% and 20%. The percentage of softwood was comparable in all ecoregions. In ecoregions 1, 2, 3, and 4, white birch was the second most represented species, whereas red maple had the highest occurrence in ecoregions 5, 6, and 7. In the hardwood-dominated plots, the occurrence of white birch was particularly high in ecoregion 1 (33%) and ecoregion 4 (28%). In ecoregion 3, sugar maple was most present (28%) as compared to the other species as well as the most present compared to other ecoregions. Yellow birch had a higher presence in hardwood-dominated stands from all ecoregions than in softwood-dominated stands, ranging from 1% in ecoregion 7 to 17% in ecoregion 3.
3.2.2. Relative Stand Density
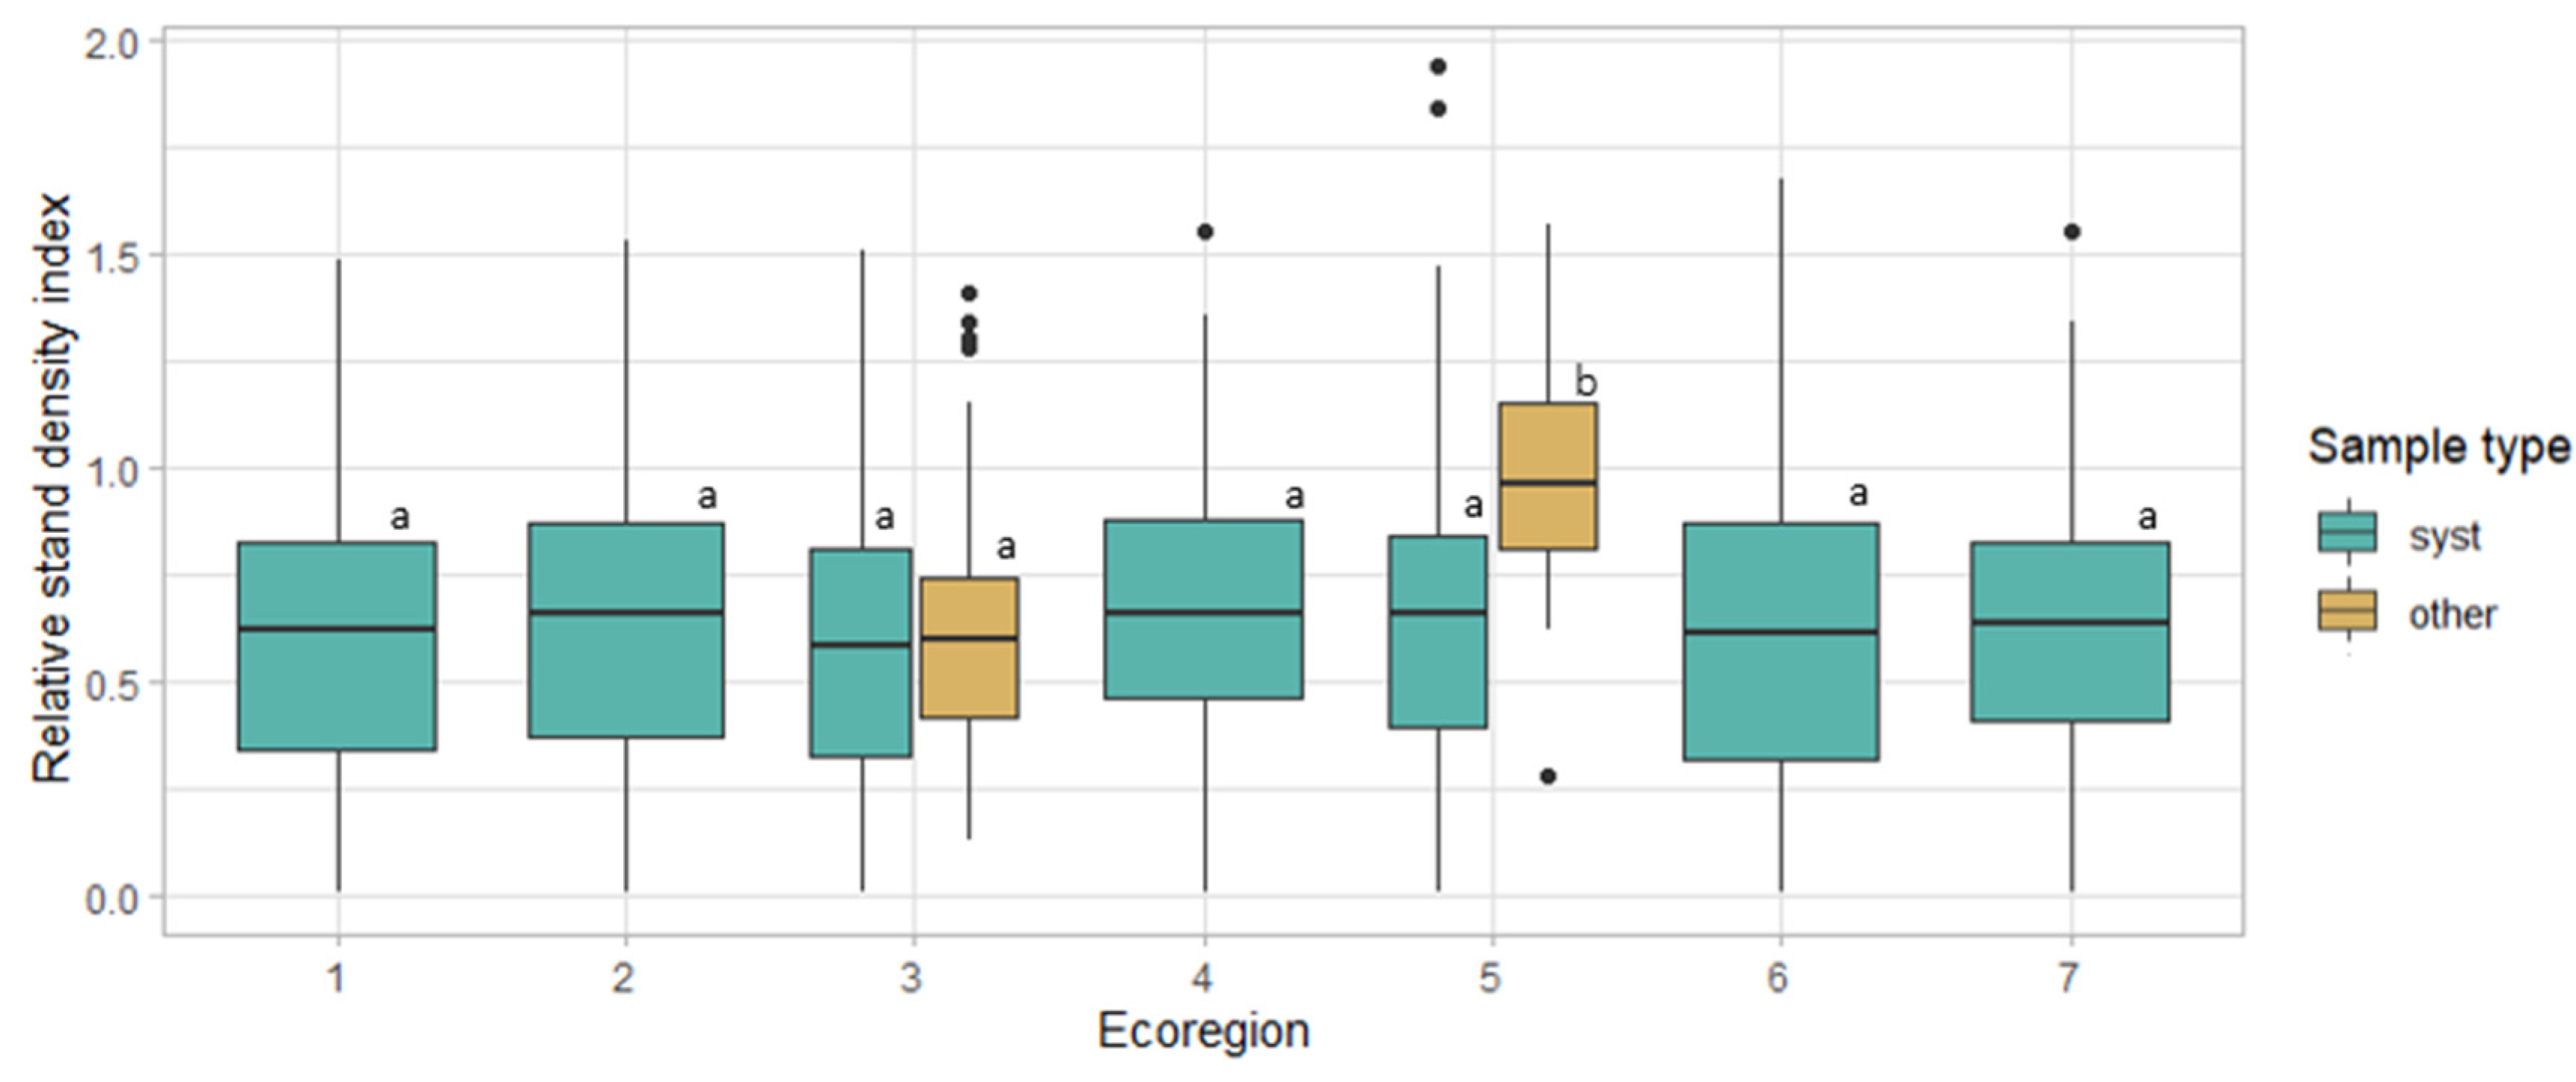
The relative stand density of plots had a mean of 0.63. This index was significantly influenced by ecoregion and sample type and the interaction of both (ANOVA, in both cases, Pr(>F)-value < 0.05; Table S3: ANOVA table of relative stand density index (RSDI), whereas the dominance of the plot concerning hardwood or softwood did not have a significant influence. The Tukey-HSD post hoc test showed that all plots inventoried in a systematic way, no matter in which ecoregion they are, do not differ significantly. For the plots inventoried in another way, those in ecoregion 3 do not differ significantly from the plots chosen in a systematic way, whereas the plots in ecoregion 5 are different (Figure 5).
3.2.3. Form and Risk Classes
Form was assessed for 25,560 trees in the plots with geographical information. The form group of a tree was significantly influenced by the grouped tree species, the dominance of the plot, the sample type, and the RSDI of the plot and some of the interactions between the variables (multinomial logistic regression and ANOVA type II, Table S4).
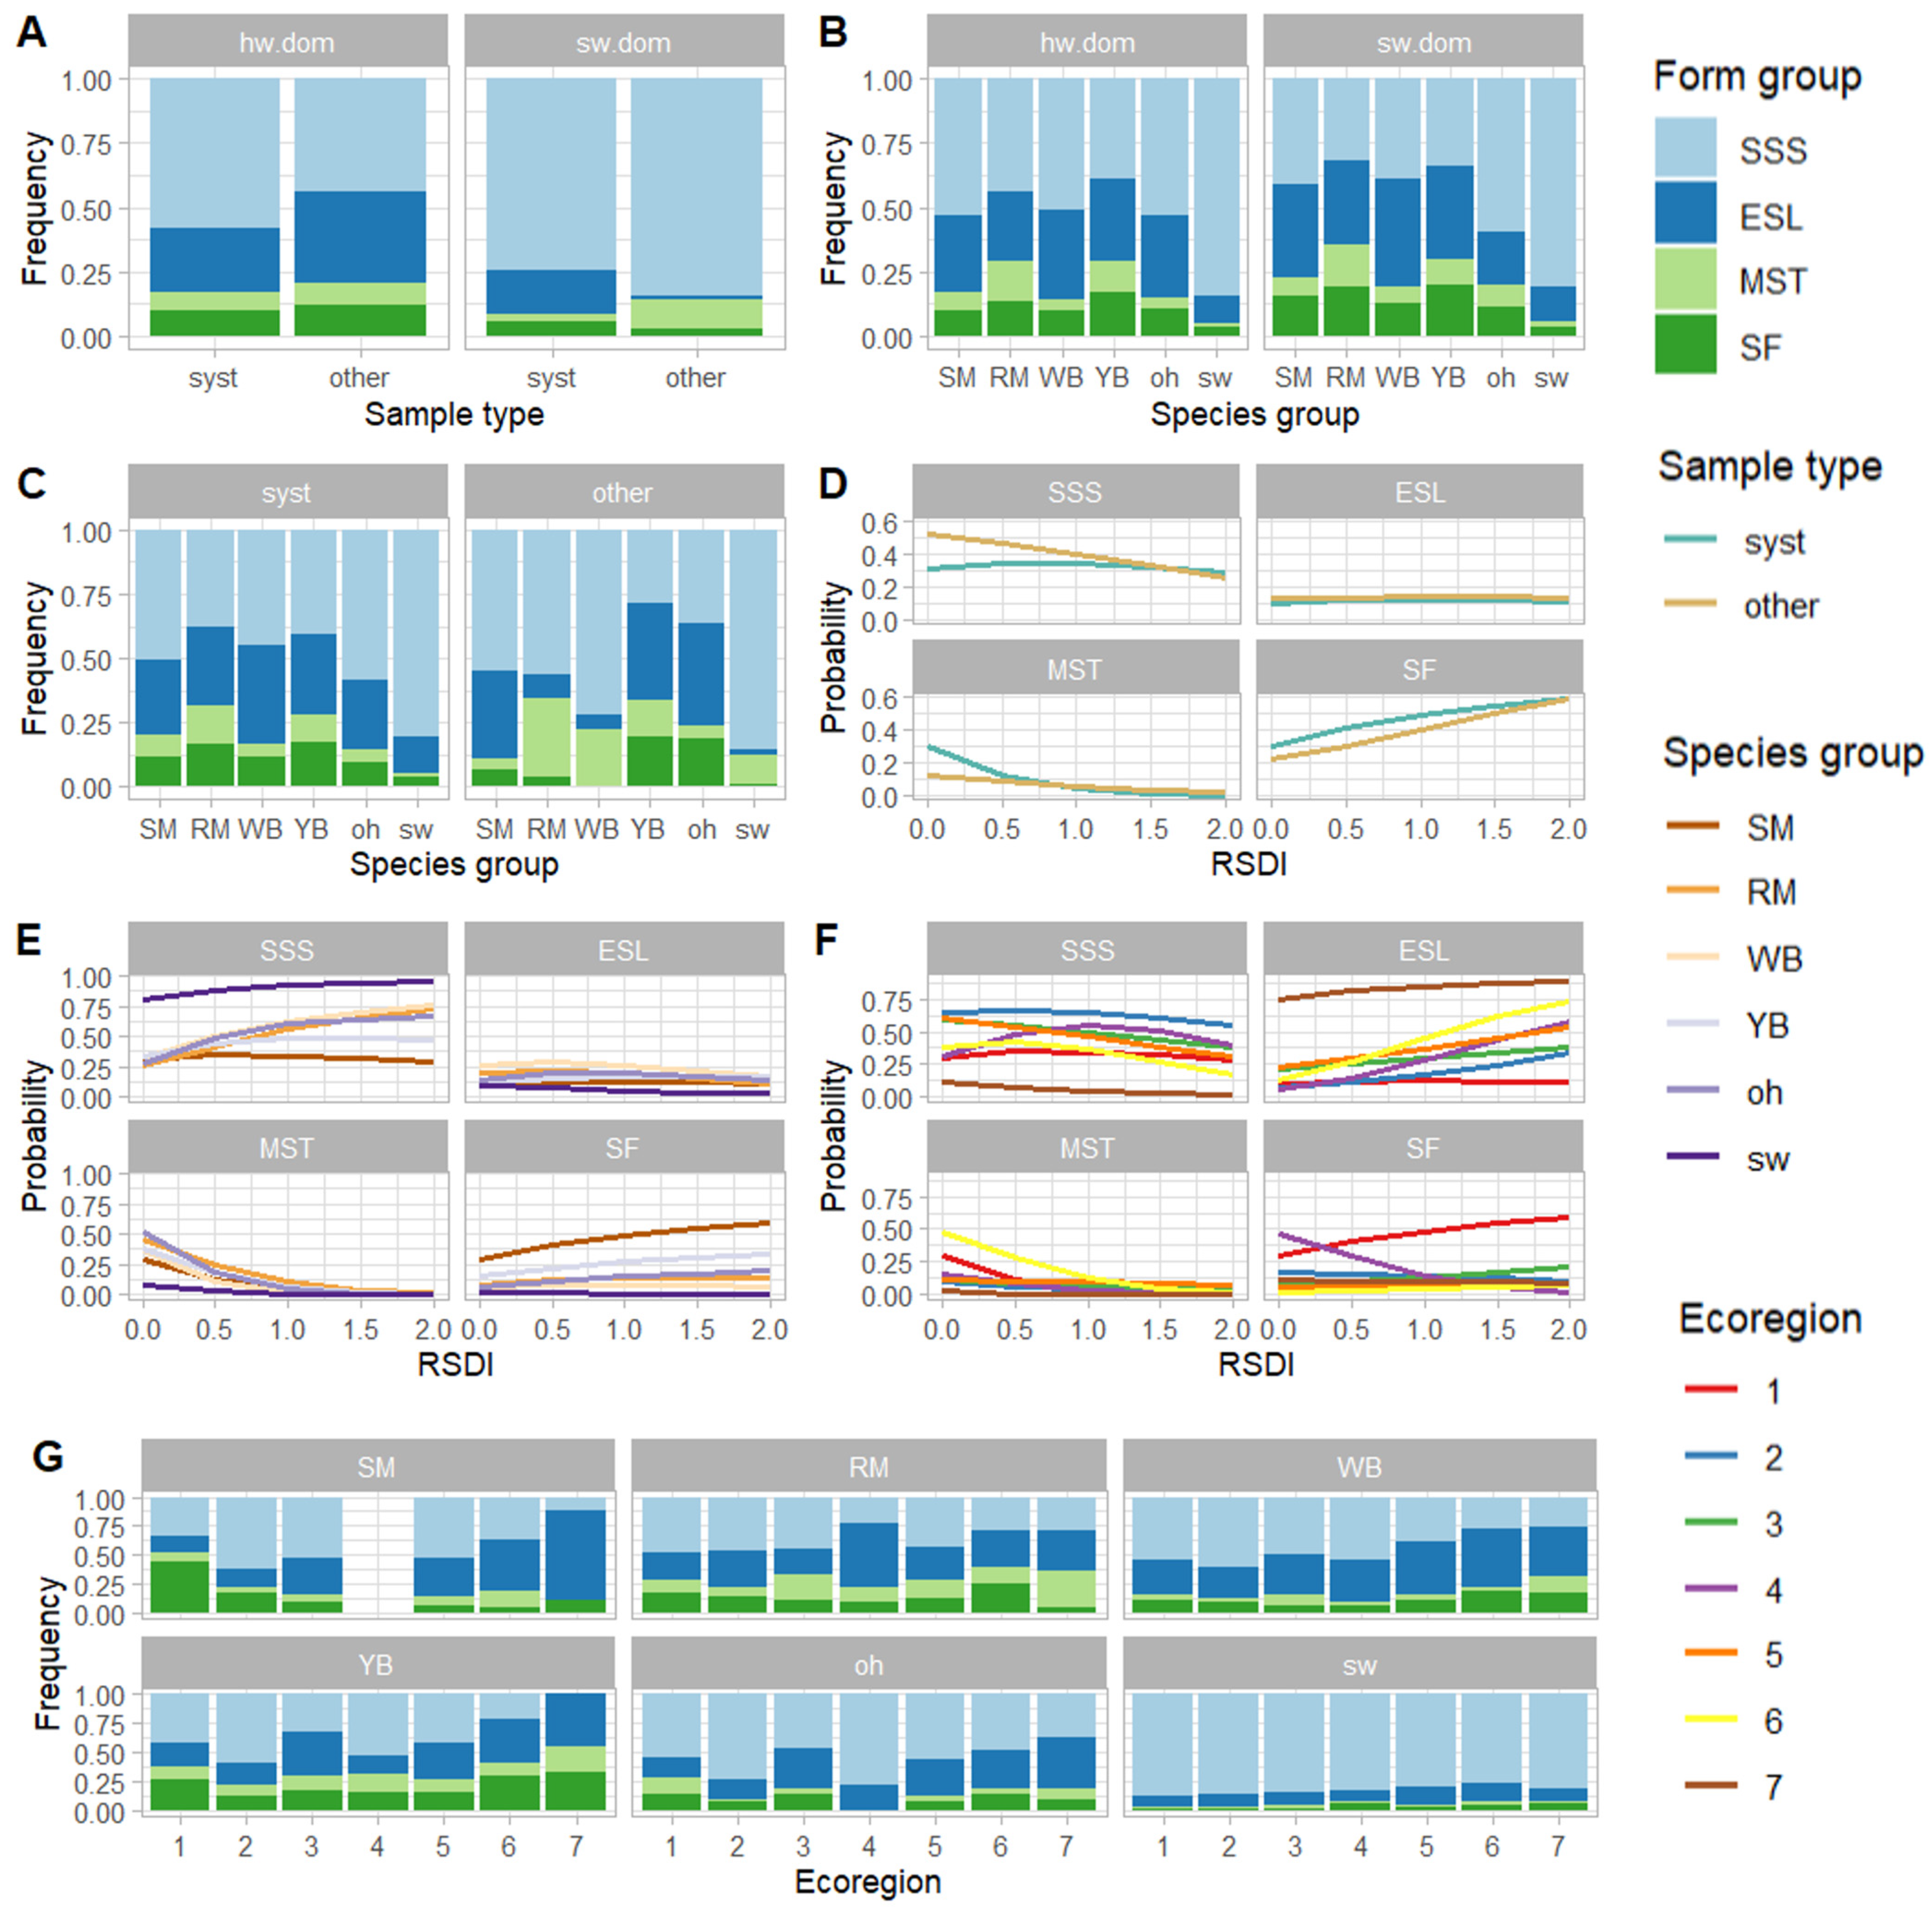
Form groups were not evenly distributed with SSS (single straight stem) being overrepresented (69% of observations). The lowest proportion of SSS (48%) was reached in hardwood-dominated plots not chosen systematically, whereas the highest proportion (84%) was linked to the plots located in softwood-dominated stands not chosen systematically (Figure 6A). The distribution of tree form varied by tree species, with red maple and yellow birch having the lowest frequency of SSS both in hardwood- and softwood-dominated stands (Figure 6B). The same trend was apparent for the plots selected systematically (Figure 6C). The impact of species on the frequency of SSS also varied among ecoregion (Figure 6G). In the plots selected in a systematic way, the probability of obtaining a single straight stem remained in a comparable range for all stand densities, whereas a reduction in the probability with increasing RSDI was observed for trees in the plots chosen in another way (Figure 6C). The probability of obtaining a straight stem was proportional to stand density for all species but sugar maple (Figure 6E). The interaction between stand density and ecoregion was more complex: for some ecoregions, the probability of straight stems decreased with the RSDI, while for others it was rather a curvilinear relationship (Figure 6F). For most of the ecoregions, the proportion of single straight stems showed a slight decrease with increasing RSDI (Figure 6F).
Trees with extensive sweep or lean (ESL) were the second most frequent group (20%). The frequency of this form class varied with the interactions between stand type, sample type, species group, and ecoregion: higher values were found for hardwood stands with non-systematic sampling (Figure 6A), white birch in both hardwood and softwood stands (Figure 6B), yellow birch and other hardwoods in non-systematic sampling (Figure 6C), and in sugar maple in ecoregion 7 (Figure 6G). There is a clear positive relationship between the occurrence of this form class and stand density for all ecoregions except ecoregion 1 (Figure 6F), but no clear effect of the RSDI in interaction with the species group or the sample type (Figure 6D,E).
The frequency of multiple stems (MST) was less frequent (5%). There was a consistent decrease in probability with increasing stand density in the interaction with the sampling type, species group and ecoregion (Figure 6D–F). Higher probabilities were found in hardwood stands with non-systematic sampling (Figure 6A), red maple in both hardwood and softwood stands (Figure 6B), red maple and white birch with non-systematic sampling (Figure 6C), and red maple in ecoregion 7 (Figure 6G).
Finally, trees with significant fork (SF, 7% in total) were more prevalent in hardwood stands with non-systematic sampling (Figure 6A), yellow birch and red maple in both stand types (Figure 6B), yellow birch and other hardwoods in non-systematic sampling (Figure 6C), and sugar maple in ecoregion 1 (Figure 6G). The relationship between stand density and the probability of significant forks was complex: there was a positive relationship for both sample type, sugar maple, and ecoregion 1 but an inverse relationship or no clear relationship in other cases (Figure 6D,F).
Risk classes, assessed for 25,516 trees, were not evenly distributed with a higher representation for class R1. Risk was significantly influenced by tree species, dominance of the plot, sample type chosen for inventory, the ecoregion, and the relative stand density of the plot as well as the interaction between the independent variables (multinomial logistic regression and ANOVA type II, Table S5).
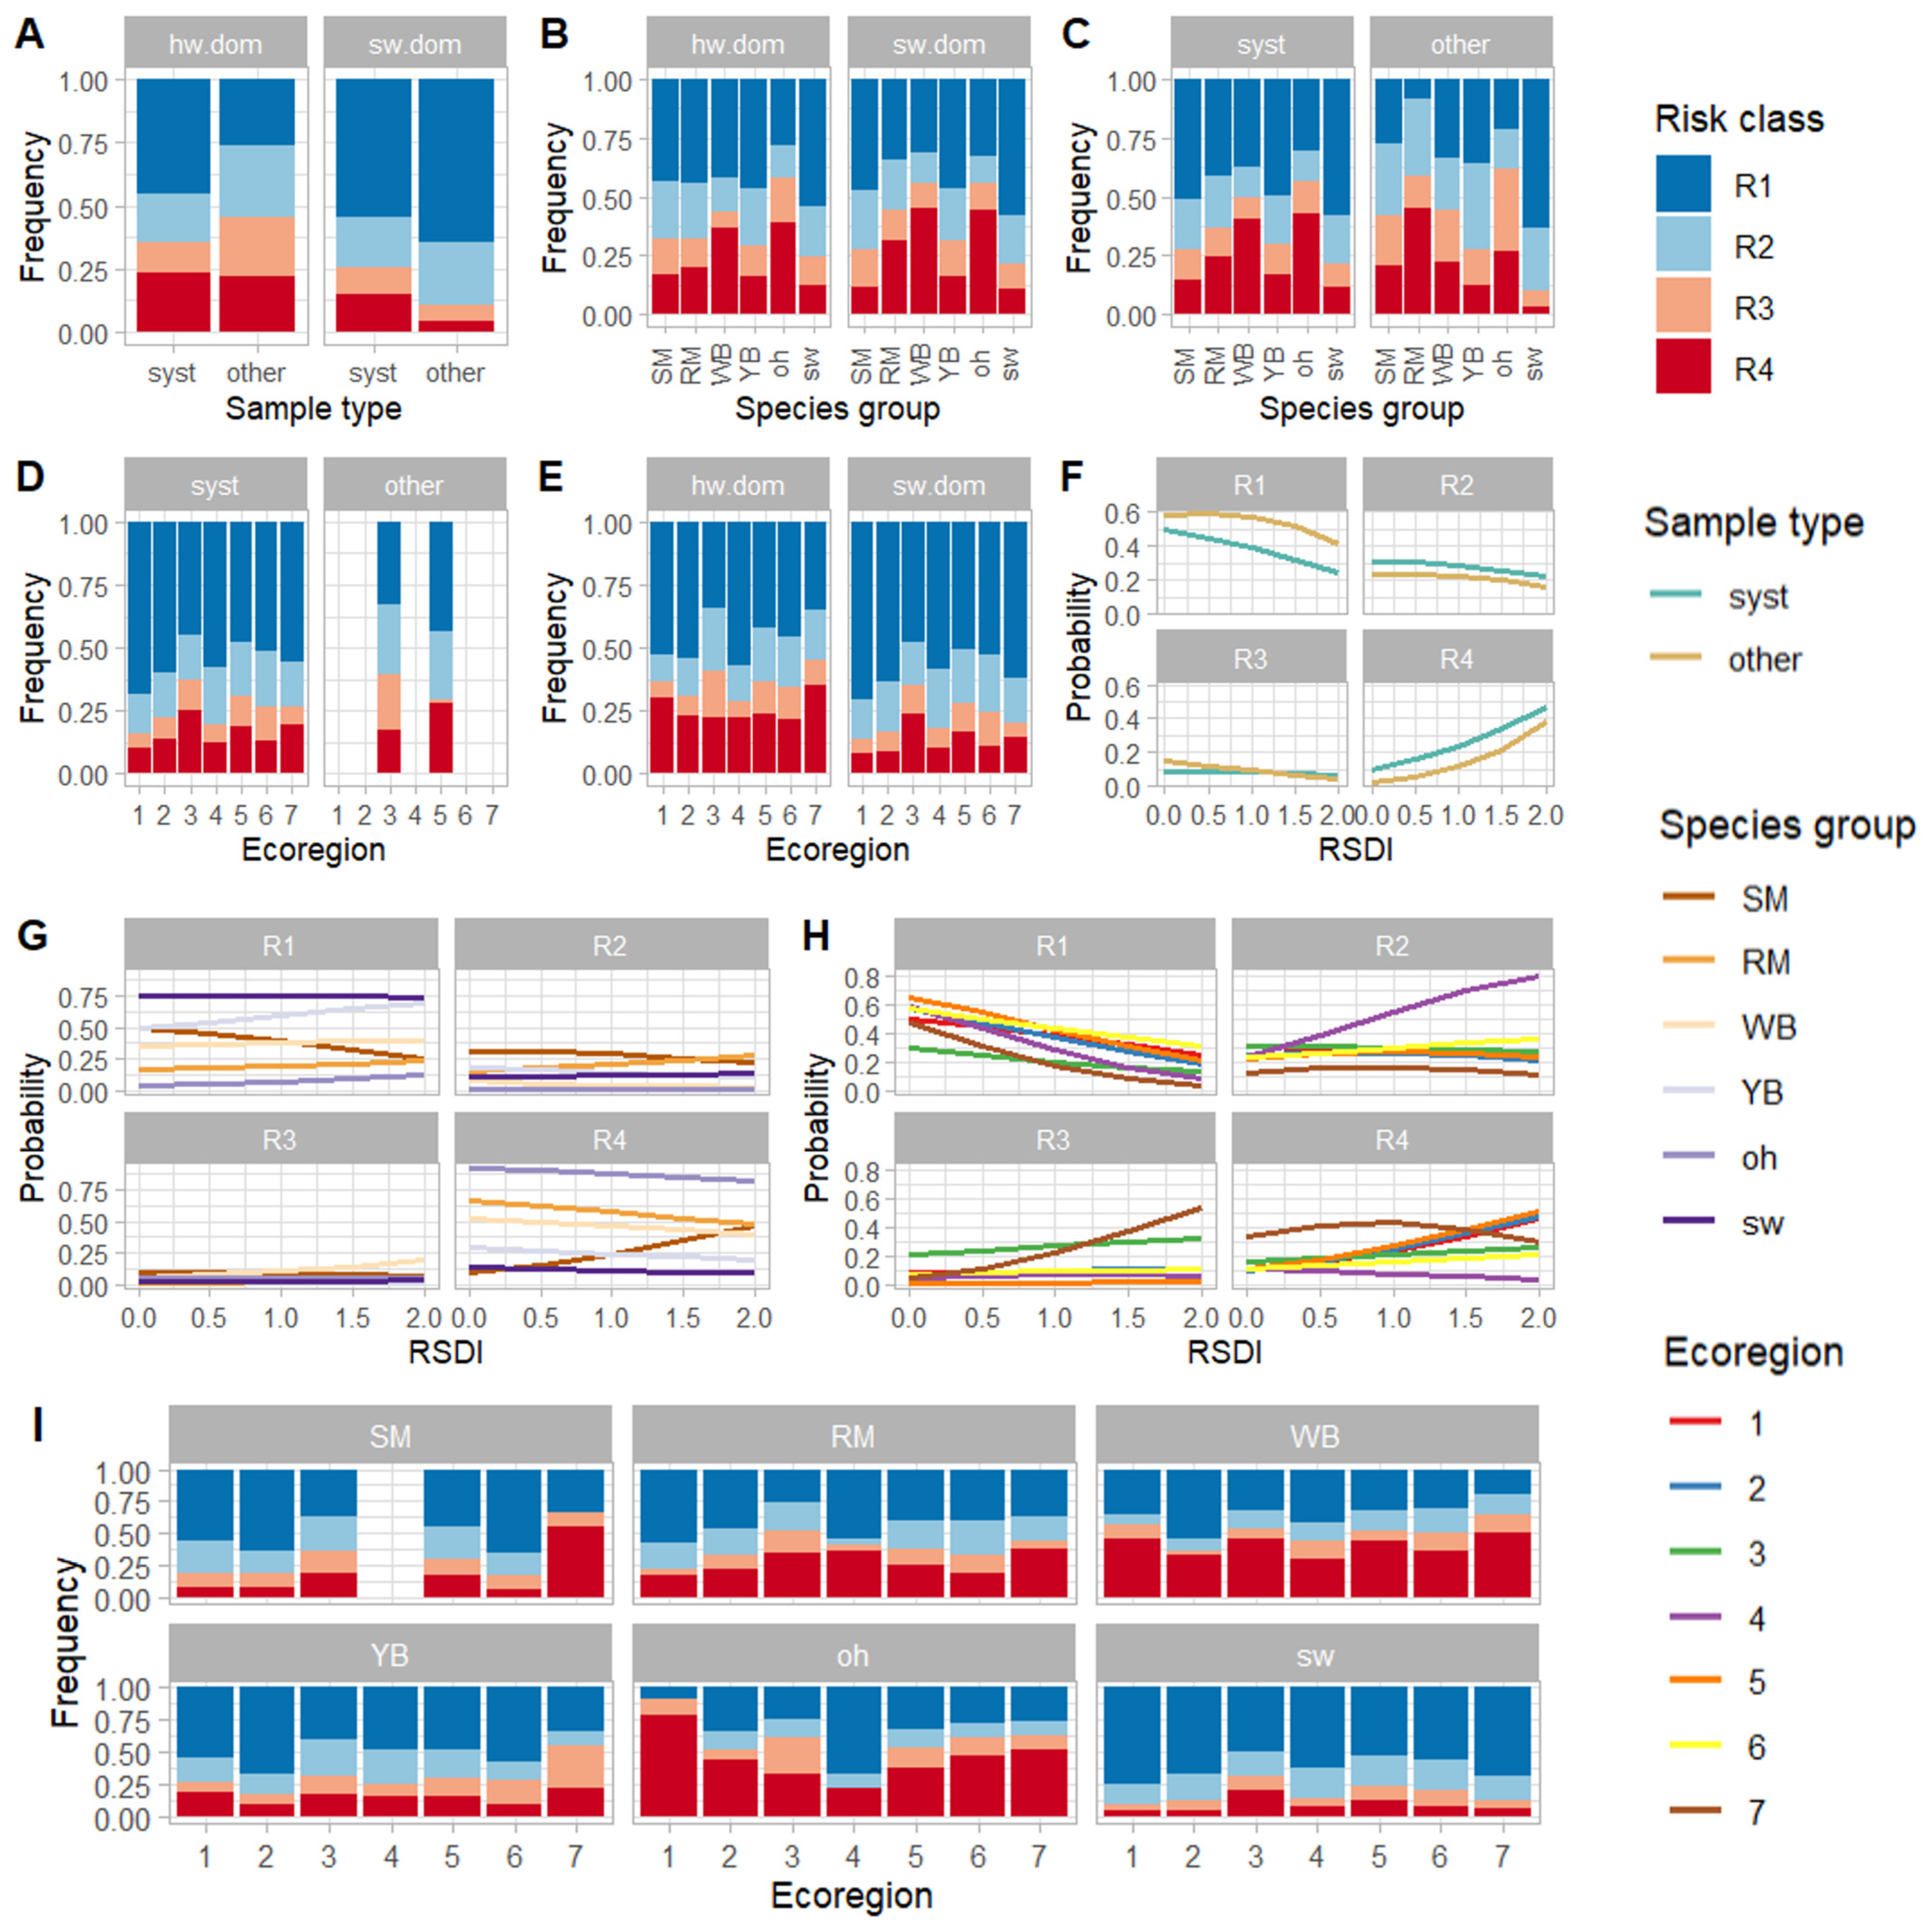
In the softwood-dominated plots, trees inventoried in a plot that was not systematically selected had a lower risk of degradation as compared to systematically selected plots. In hardwood-dominated plots, the opposite was noticed (Figure 7A). Differences were more subtle when considering tree species (Figure 7B). In systematically selected plots, 50% or more of the trees inventoried had risk class 1, and therefore a very low risk of degradation within the following years, for sugar maple (51%), yellow birch (50%) and softwoods (58%). In the plots selected in another method, the R1 class was less represented in all species groups except softwoods (Figure 7C). In all systematically selected plots over all ecoregions, trees with low risk of degradation and degeneration (R1 and R2) were predominant (Figure 7D). When considering the hardwood-dominated plots, a rather constant amount of R1 trees were reported in all ecoregions (Figure 7E). For all risk classes, different sample types showed comparable trends in probability of occurrence depending on the RSDI (Figure 7F). The probability of having a low risk (R1) for sugar maple decreased with an increase in RSDI, as compared to the other tree species where it remained similar or increased with the RSDI (Figure 7G). In all ecoregions, trees with a risk class R1 were less likely to be found in denser stands. In ecoregions 1, 2 and 5, the probability for a tree to be classified as R4 (high risk) increased with stand density (Figure 7H). In general, hardwoods presented a higher risk than softwood species. Specifically, white birch had the highest proportion of high-risk group in all seven ecoregions; compared to this, yellow birch had an overall low risk in all ecoregions (Figure 7I).
3.2.4. Diameter and Height
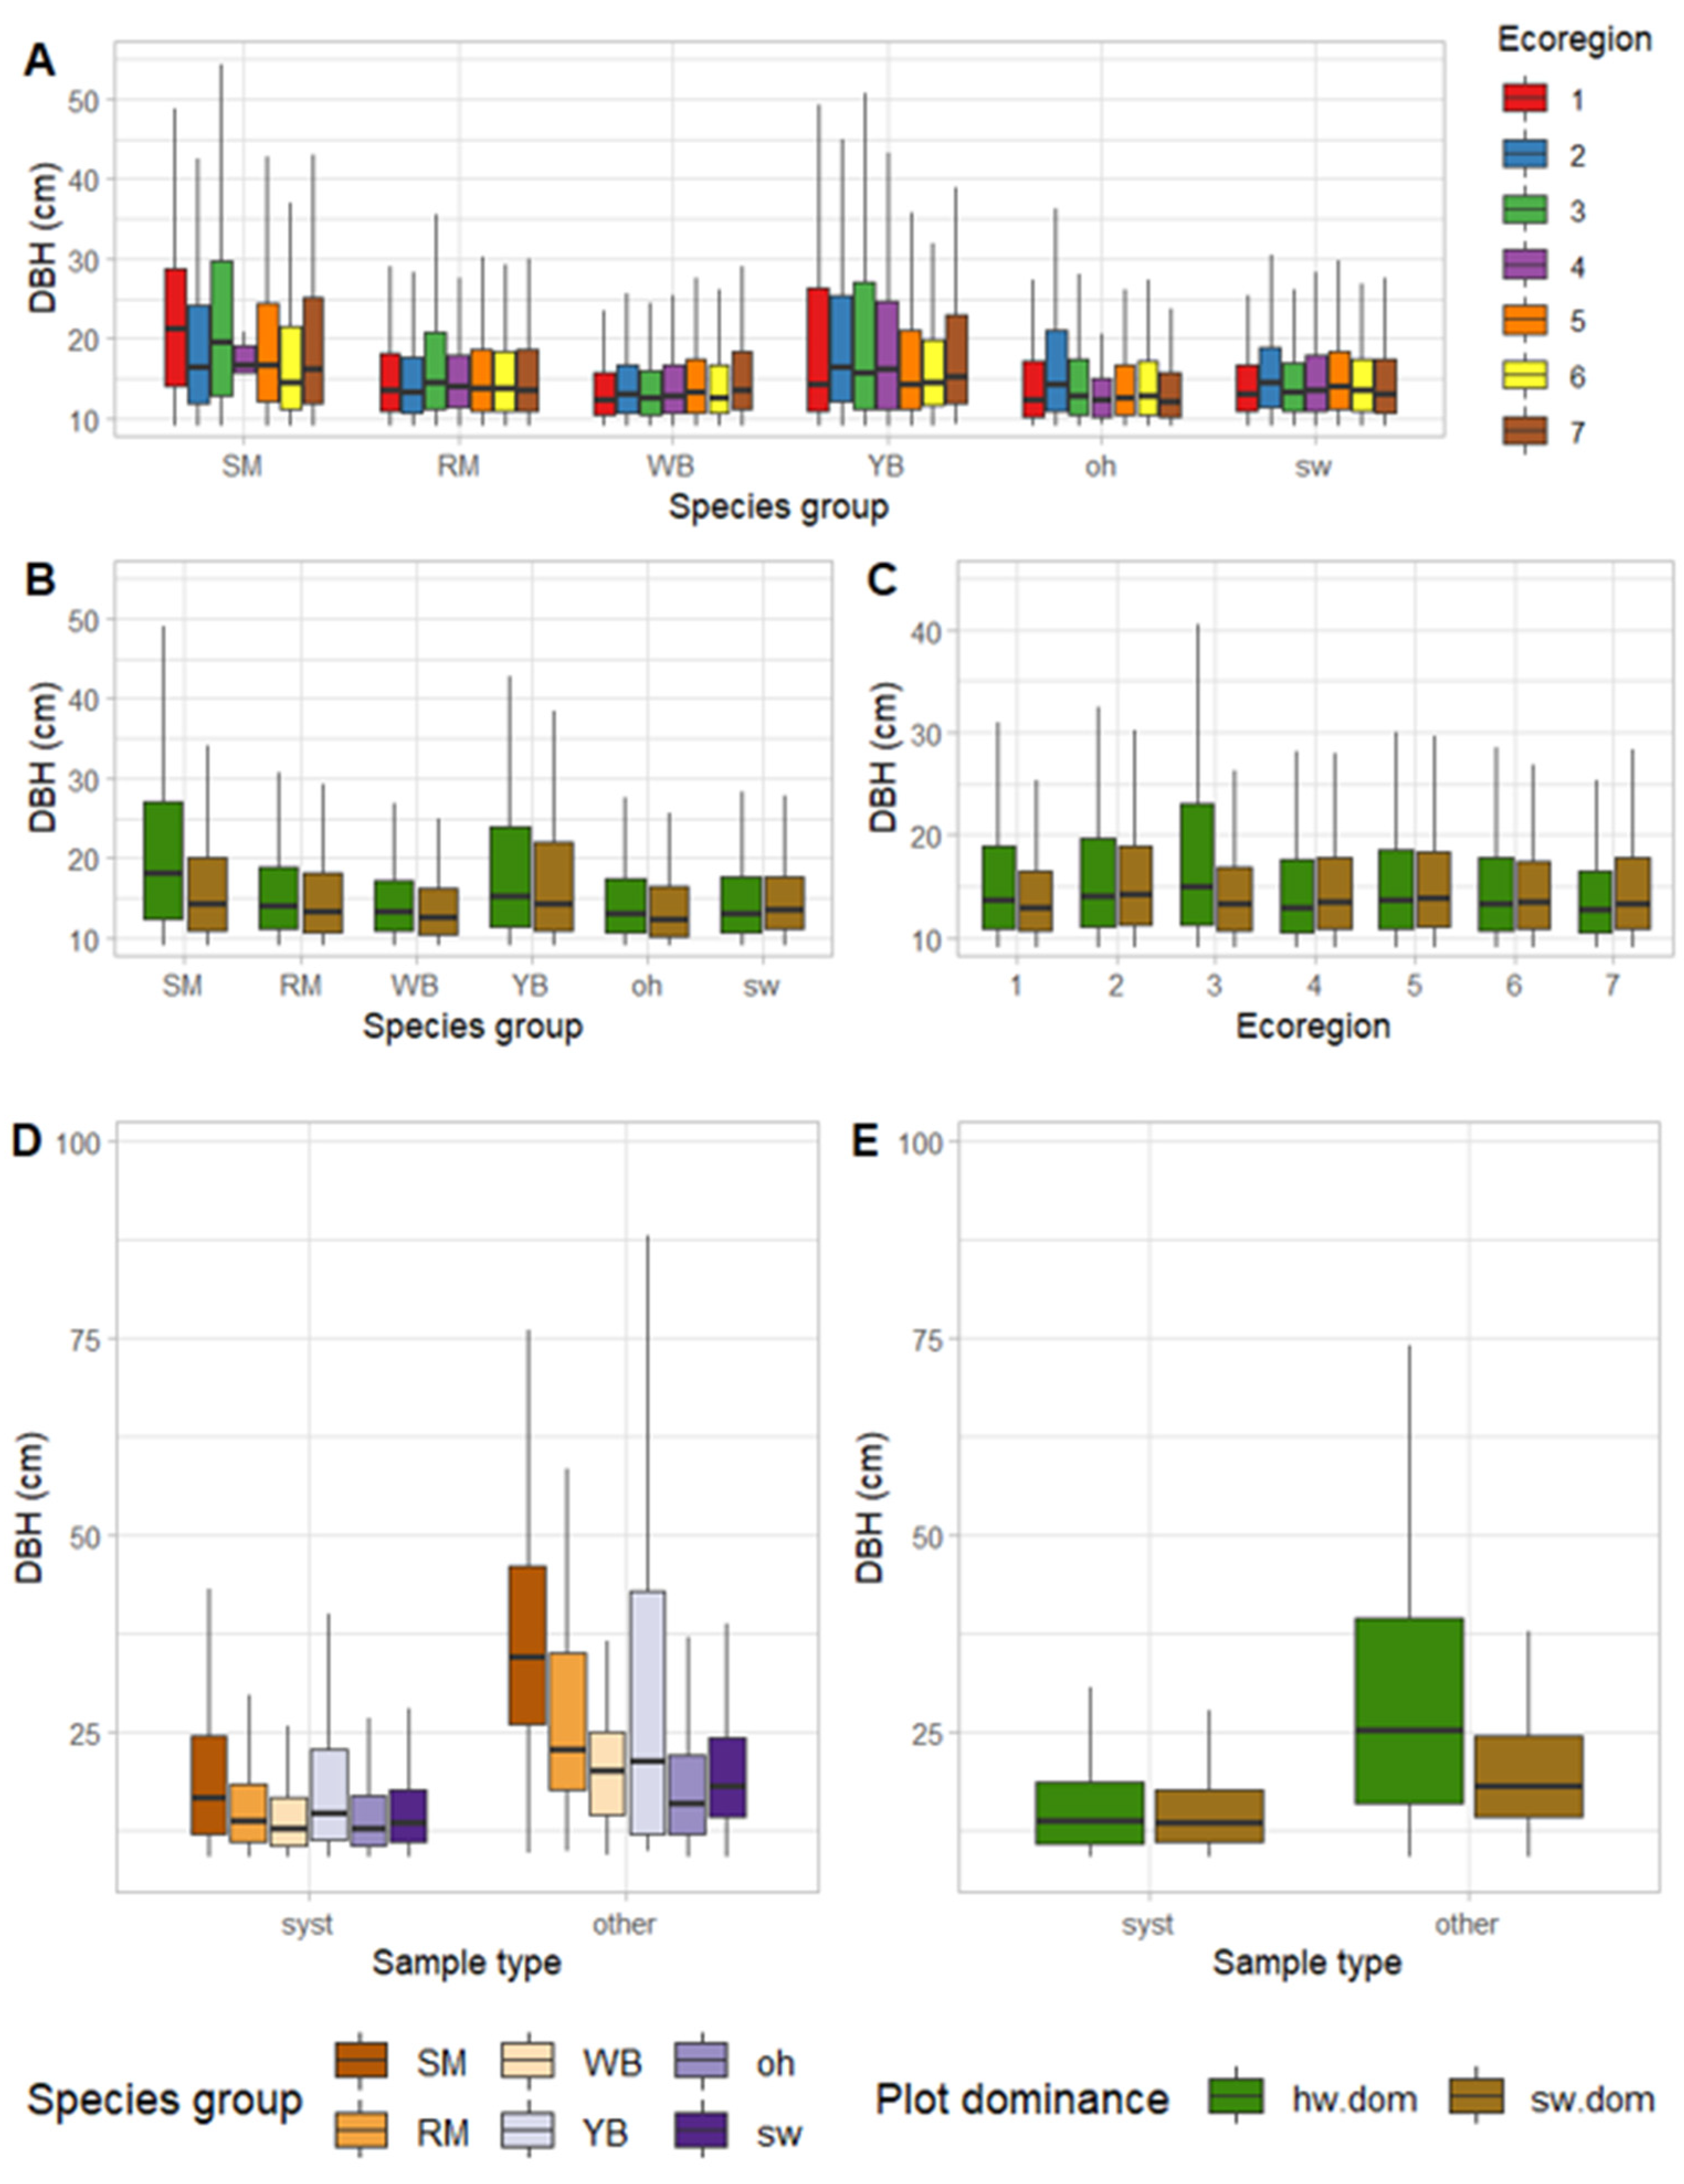
At tree level, the DBH (N= 287,984) ranged from 9.1 cm to 112.0 cm. The median DBH was 14.2 cm, while the mean was 17.1 cm. For trees with geographical information (N = 253,235), the DBH was significantly influenced by species, plot dominance, ecoregion, and sample type (ANOVA and TukeyHSD, p-values < 0.05, Table S6). The strongest variation of mean DBH between ecoregions was noticed for sugar maple, having larger trees in ecoregions 1 and 3 and smaller ones in the other ecoregions (Figure 8A). In the hardwood-dominated plots, all species groups, except softwoods, had a larger median DBH as compared to the softwood-dominated plots (Figure 8B). This trend was confirmed for all tree species in ecoregions 1 and 3. In the remaining ecoregions, the median DBH of trees was lower in the hardwood-dominated plots than in their softwood counterpart. The DBH in the hardwood-dominated plots located in ecoregion 3 was significantly different from the other ecoregions and plot dominances (Figure 8C). The DBH distribution in the plots selected in a systematic method showed less variability between species than in the non-systematically selected plots. The plots selected in a systematic method indicated that sugar maple and yellow birch tended to have the highest range of DBH and the highest median DBHs (Figure 8D). The difference between DBHs in the plots selected in a systematic method and in a non-systematic method was significantly different depending on the plot dominance (Figure 8E).
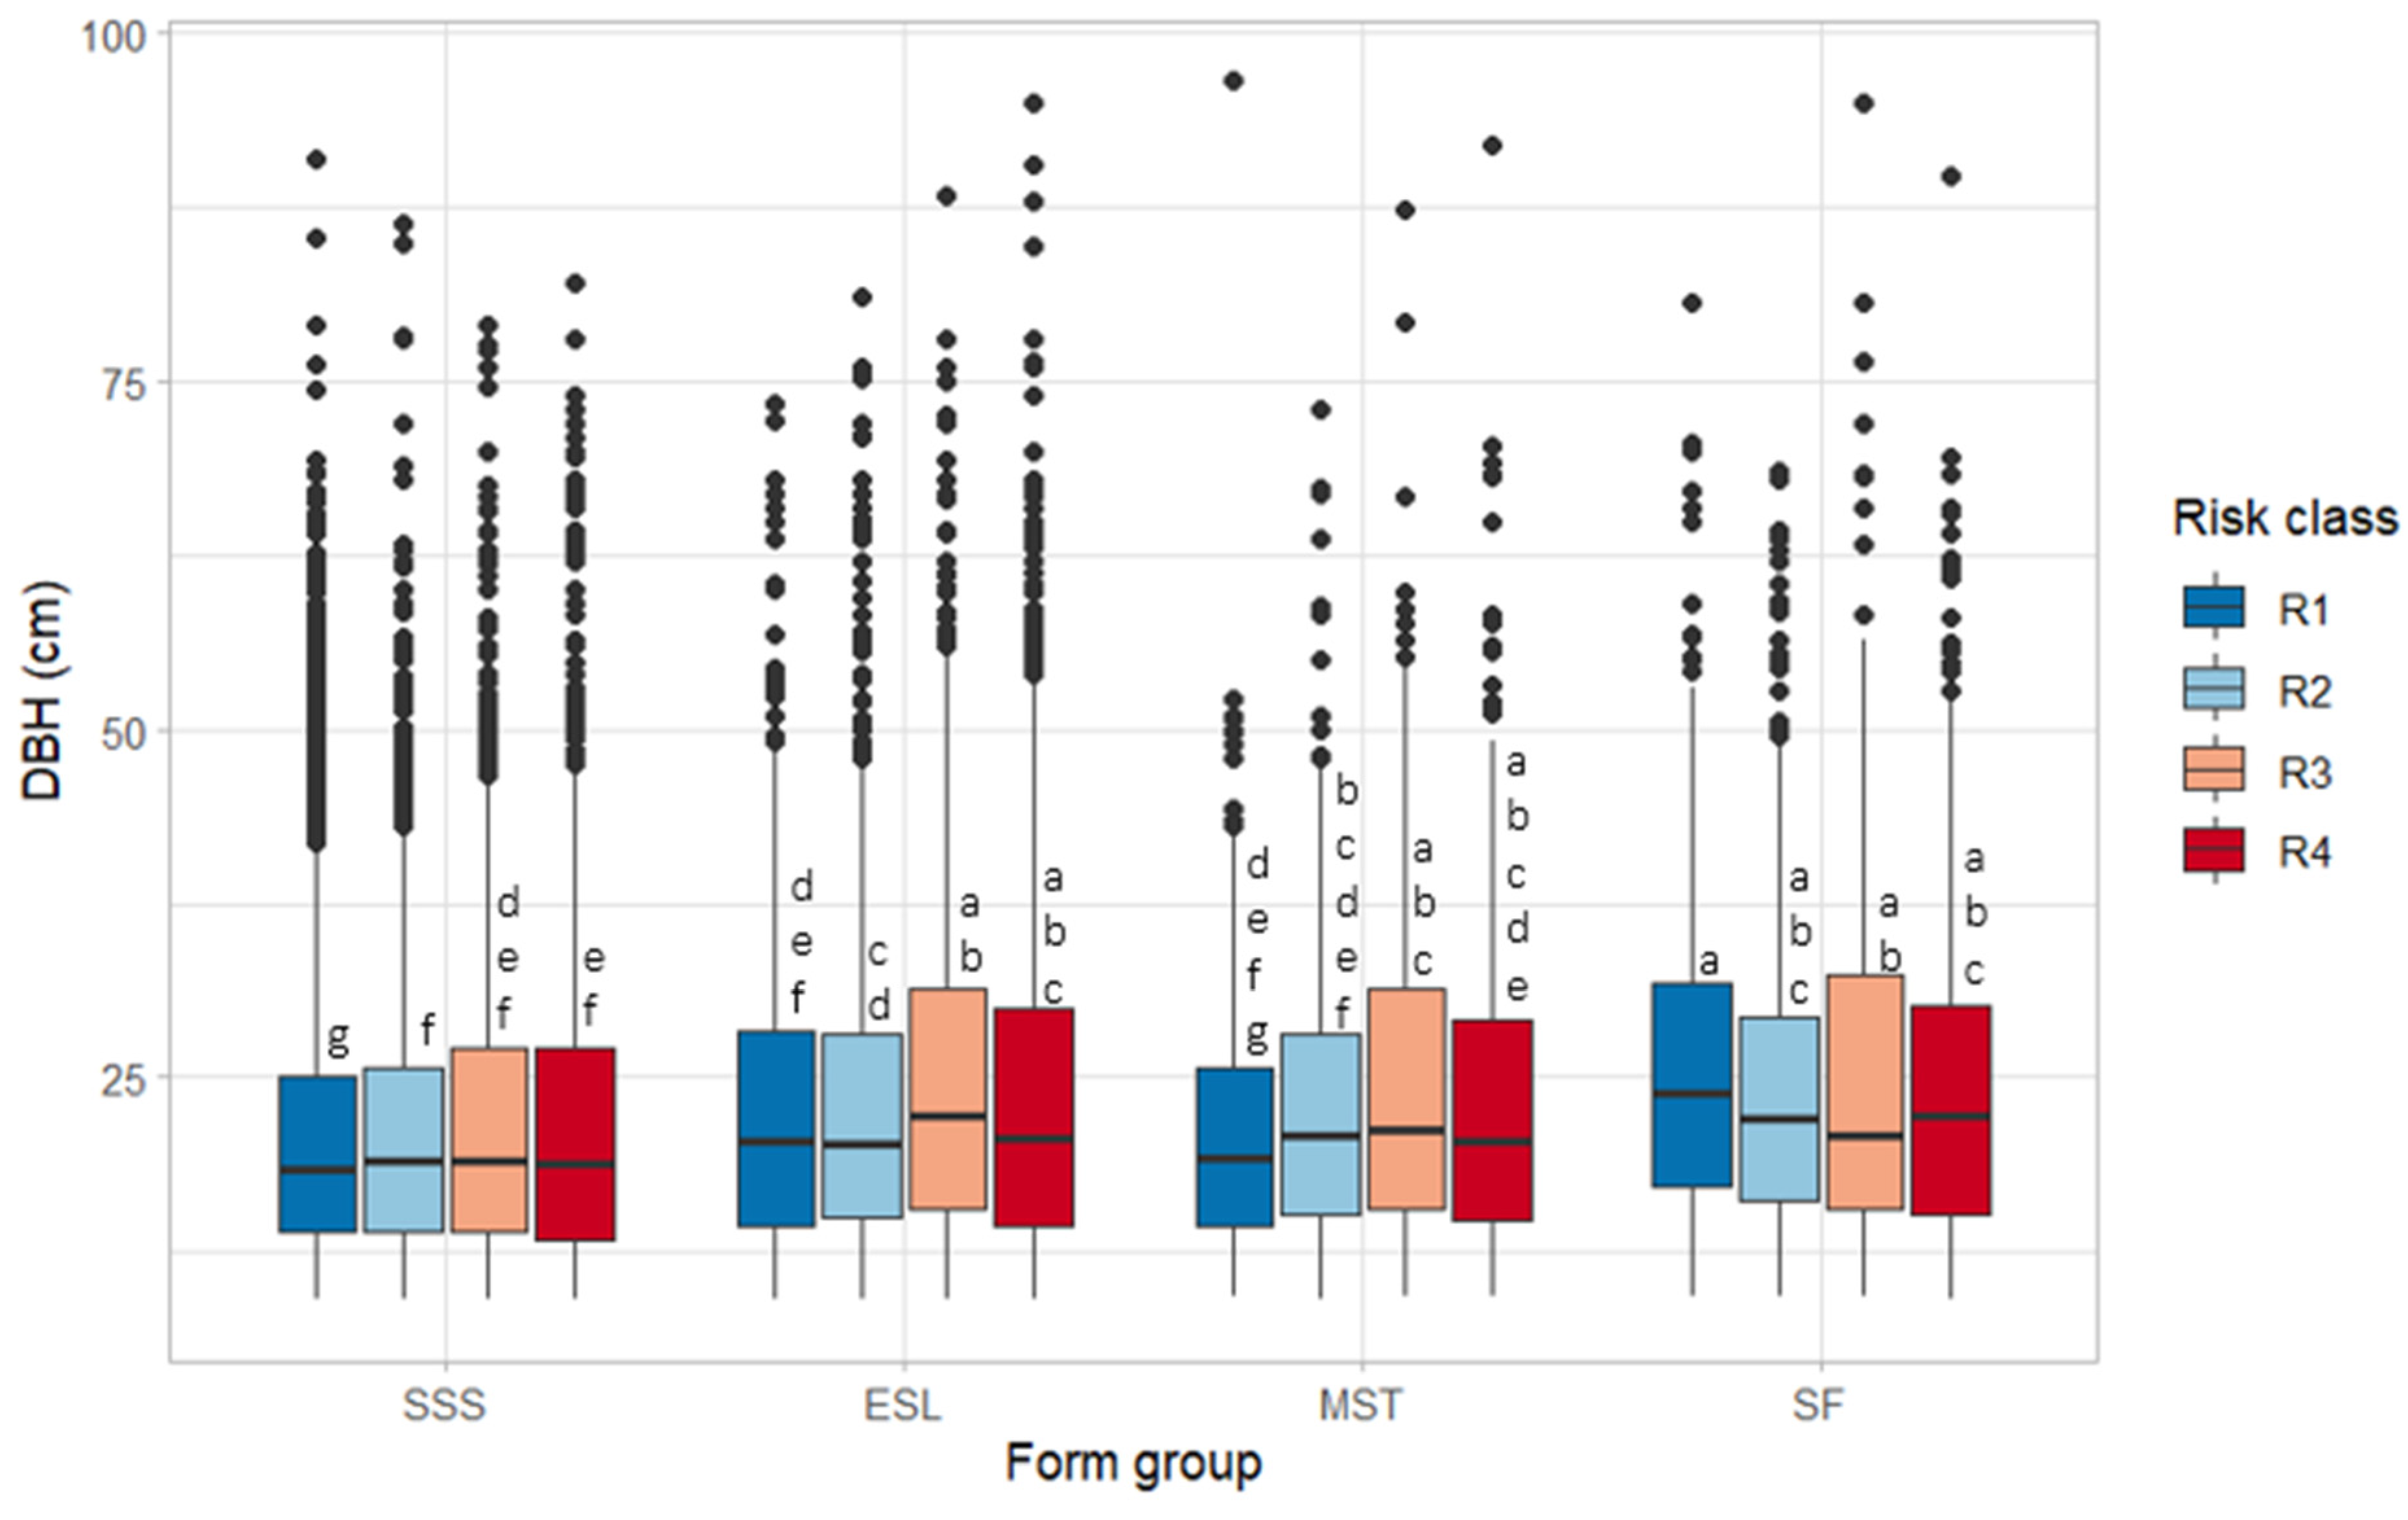
When reducing the number of observations from 253,235 to 25,516 where classes of form and risk had been assessed, the ANOVA showed a significant influence of form and risk on the DBH (Table S7). The DBH of the trees of the different form groups and risk classes varied (Figure 9). Trees with a single straight stem (SSS) with risk class 1 had a significantly different DBH than the other risk classes. Trees with extensive sweep or lean (ESL) and trees with multiple stem (MST) had comparable DBHs except for risk class 3.
Mean tree height was 14.8 m. The ANOVA of the trees located on plots with geographical information (N = 62,292) demonstrated that tree height was significantly influenced by species, plot dominance and ecoregion (Table S8). When reducing the number of observations to those having form and risk classes (N = 24,048), the grouped form and the risk class had a significative influence (Table S9).
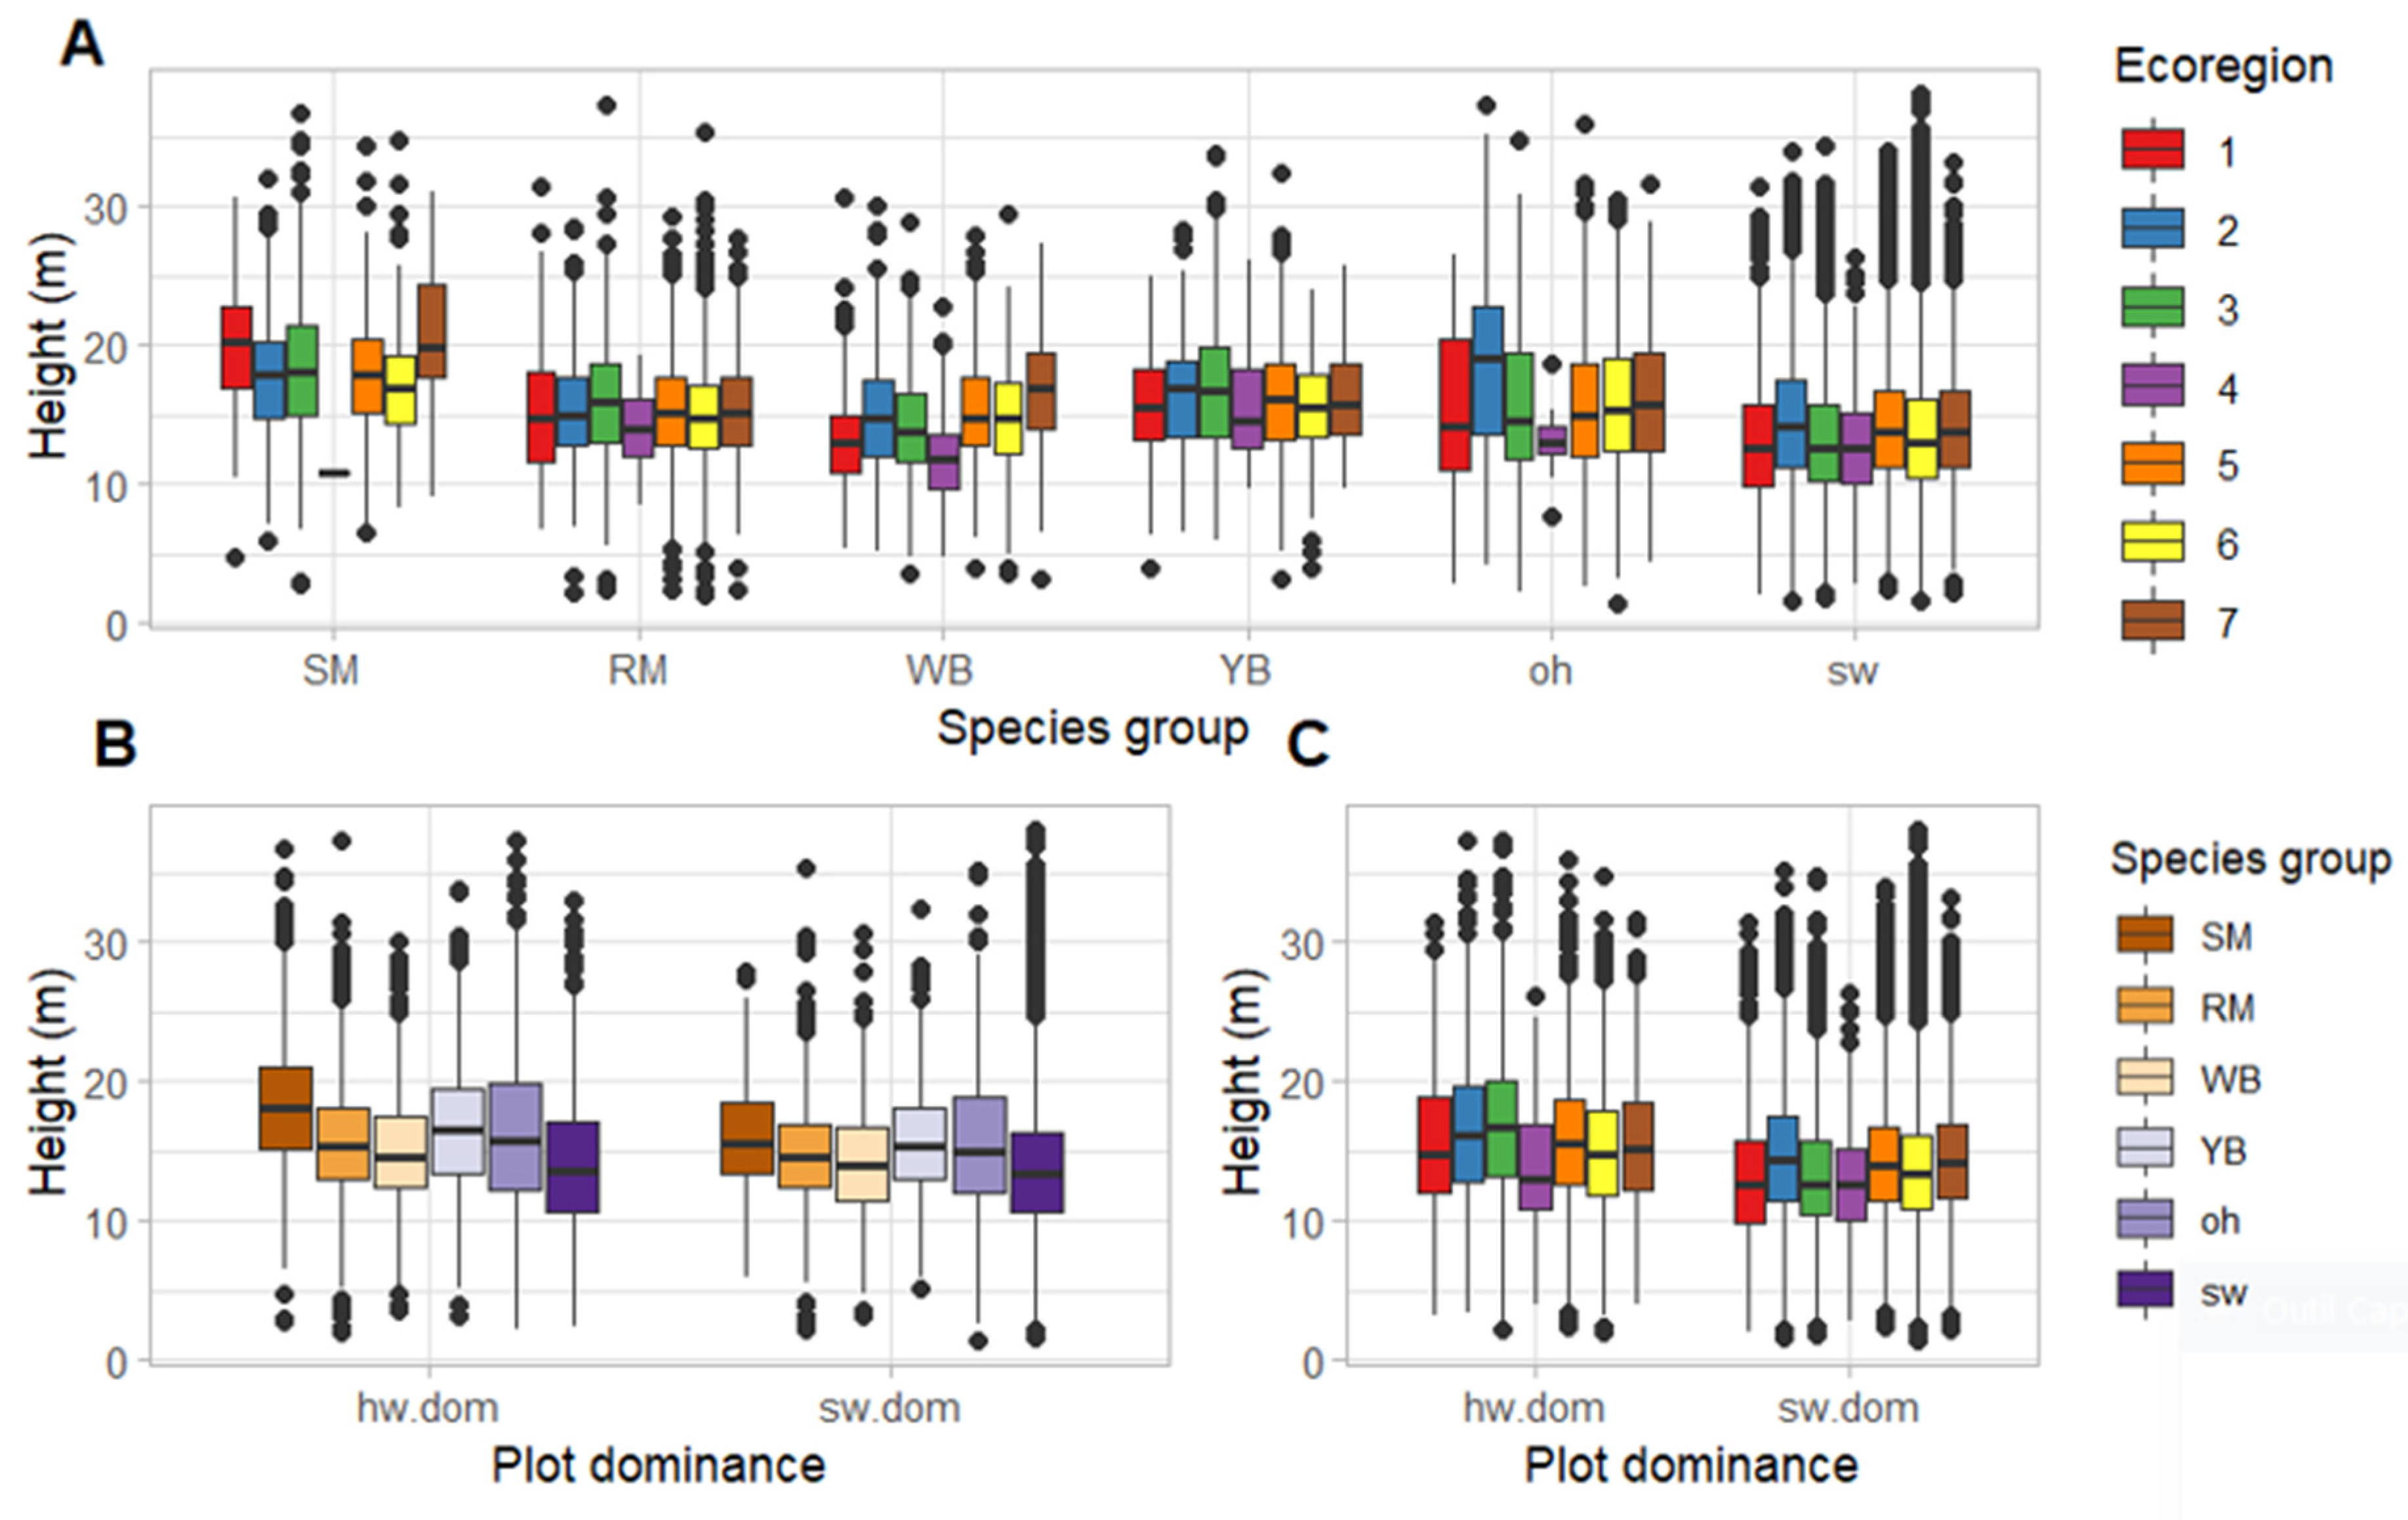
The influence of grouped species, ecoregion and plot dominance was significant but did not allow a clear group building. Sugar maple and yellow birch had the highest trees, with outstanding sugar maple both in ecoregions 1 and 7 (Figure 10A). Sugar maples were highest in both the hardwood- and softwood-dominated plots (Figure 10B). Lower tree heights were observed in ecoregion 4 for both the hardwood- and softwood-dominated plots. Tree heights in ecoregions 1 and 3 were higher in the hardwood-dominated plots than in the softwood-dominated plots (Figure 10C).
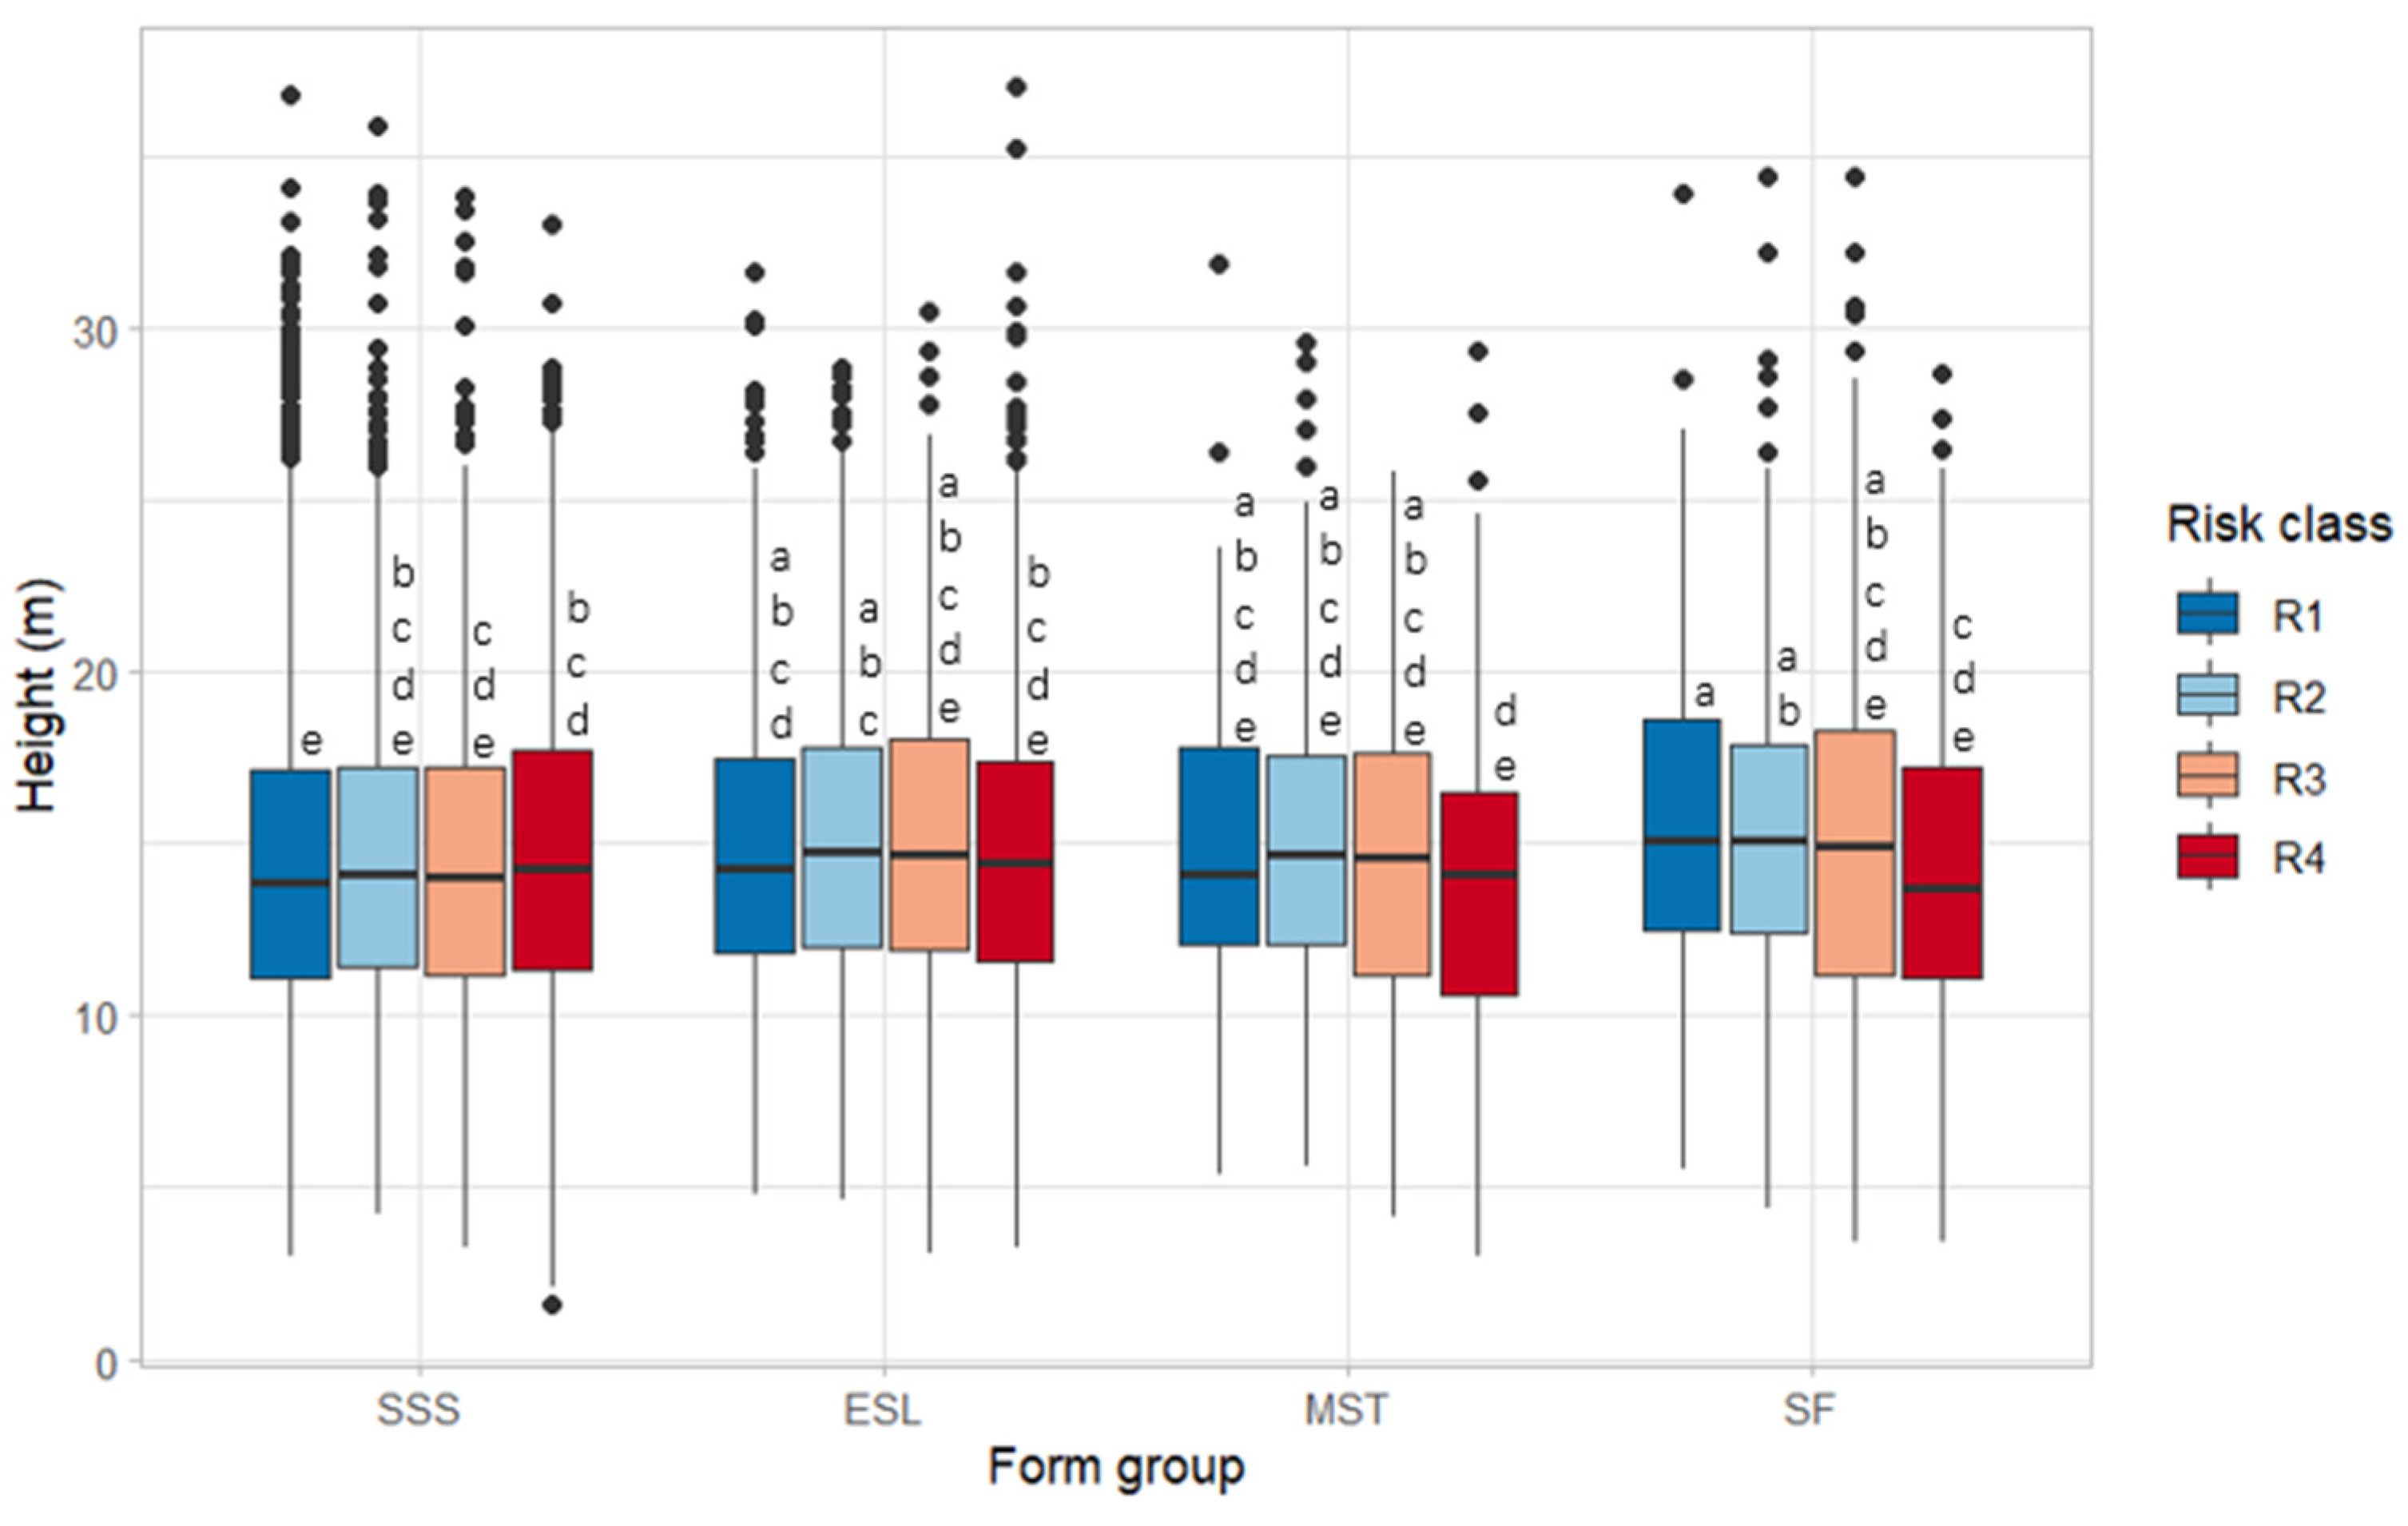
When considering form groups and risk classes, trees with a single straight stem (SSS) showed a significant difference in tree height between R1 and R4. In form group extensive sweep or lean (ESL) and in trees with multiple stems (MST), there was no significant difference between risk classes. However, trees having a significative fork (SF) showed a significant difference in height between R1 and R4 as well as between R2 and R4 (Figure 11).
3.3. Effects of Tree and Environmental Factors on the Merchantable and Sawlog Volume
3.3.1. Product Description
Slightly more than two thirds of the measured products (70.5%) originated from the main stem, while the remaining 29.5% came from branches. In total, 2315 pulp logs were produced (62.4%), 946 veneer or sawlogs (25.5%) and 451 logs were unutilized (12.1%; Table 6). For all species group, except softwoods, pulp represented more than half of the products generated. The percentage of veneer and sawlog was the highest in softwoods (59.0%), followed by other hardwoods (40.9%). In sugar maple, the veneer and sawlogs represented 27.8% of the product basket and only 13.5% for red maple. The percentage of unutilized products compared to the total products created was particularly high in yellow birch and sugar maple (16.1% and 13.3%, respectively). However, this percentage was considerably low in other hardwoods (2.2%), softwoods (4.3%), and white birch (4.8%).
The median volume of all products was 0.48 m³ (mean 0.66 m³) per tree. Specifically, the median volume of veneer and sawlogs was 0.78 m³ (mean 0.87 m³) per tree, 0.45 m³ (mean 0.55 m³) for pulp and 0.07 m³ (mean 0.23 m³) for unutilized logs. The maximum volume produced in a single tree was 3.94 m³ in a sugar maple of 82.0 cm DBH and 24.3 m height. From this volume, 25.4% was veneer or sawlogs, 73.7% pulp, and 0.9% unutilized. In the median, 32.6% (mean 34.6%) of the volume generated in the 751 trees was classified as veneer or sawlogs, 60.8% (mean 61.0%) as pulp, and 0.0% (mean 4.4%) as unutilized.
3.3.2. Factors Influencing Volume Recovery
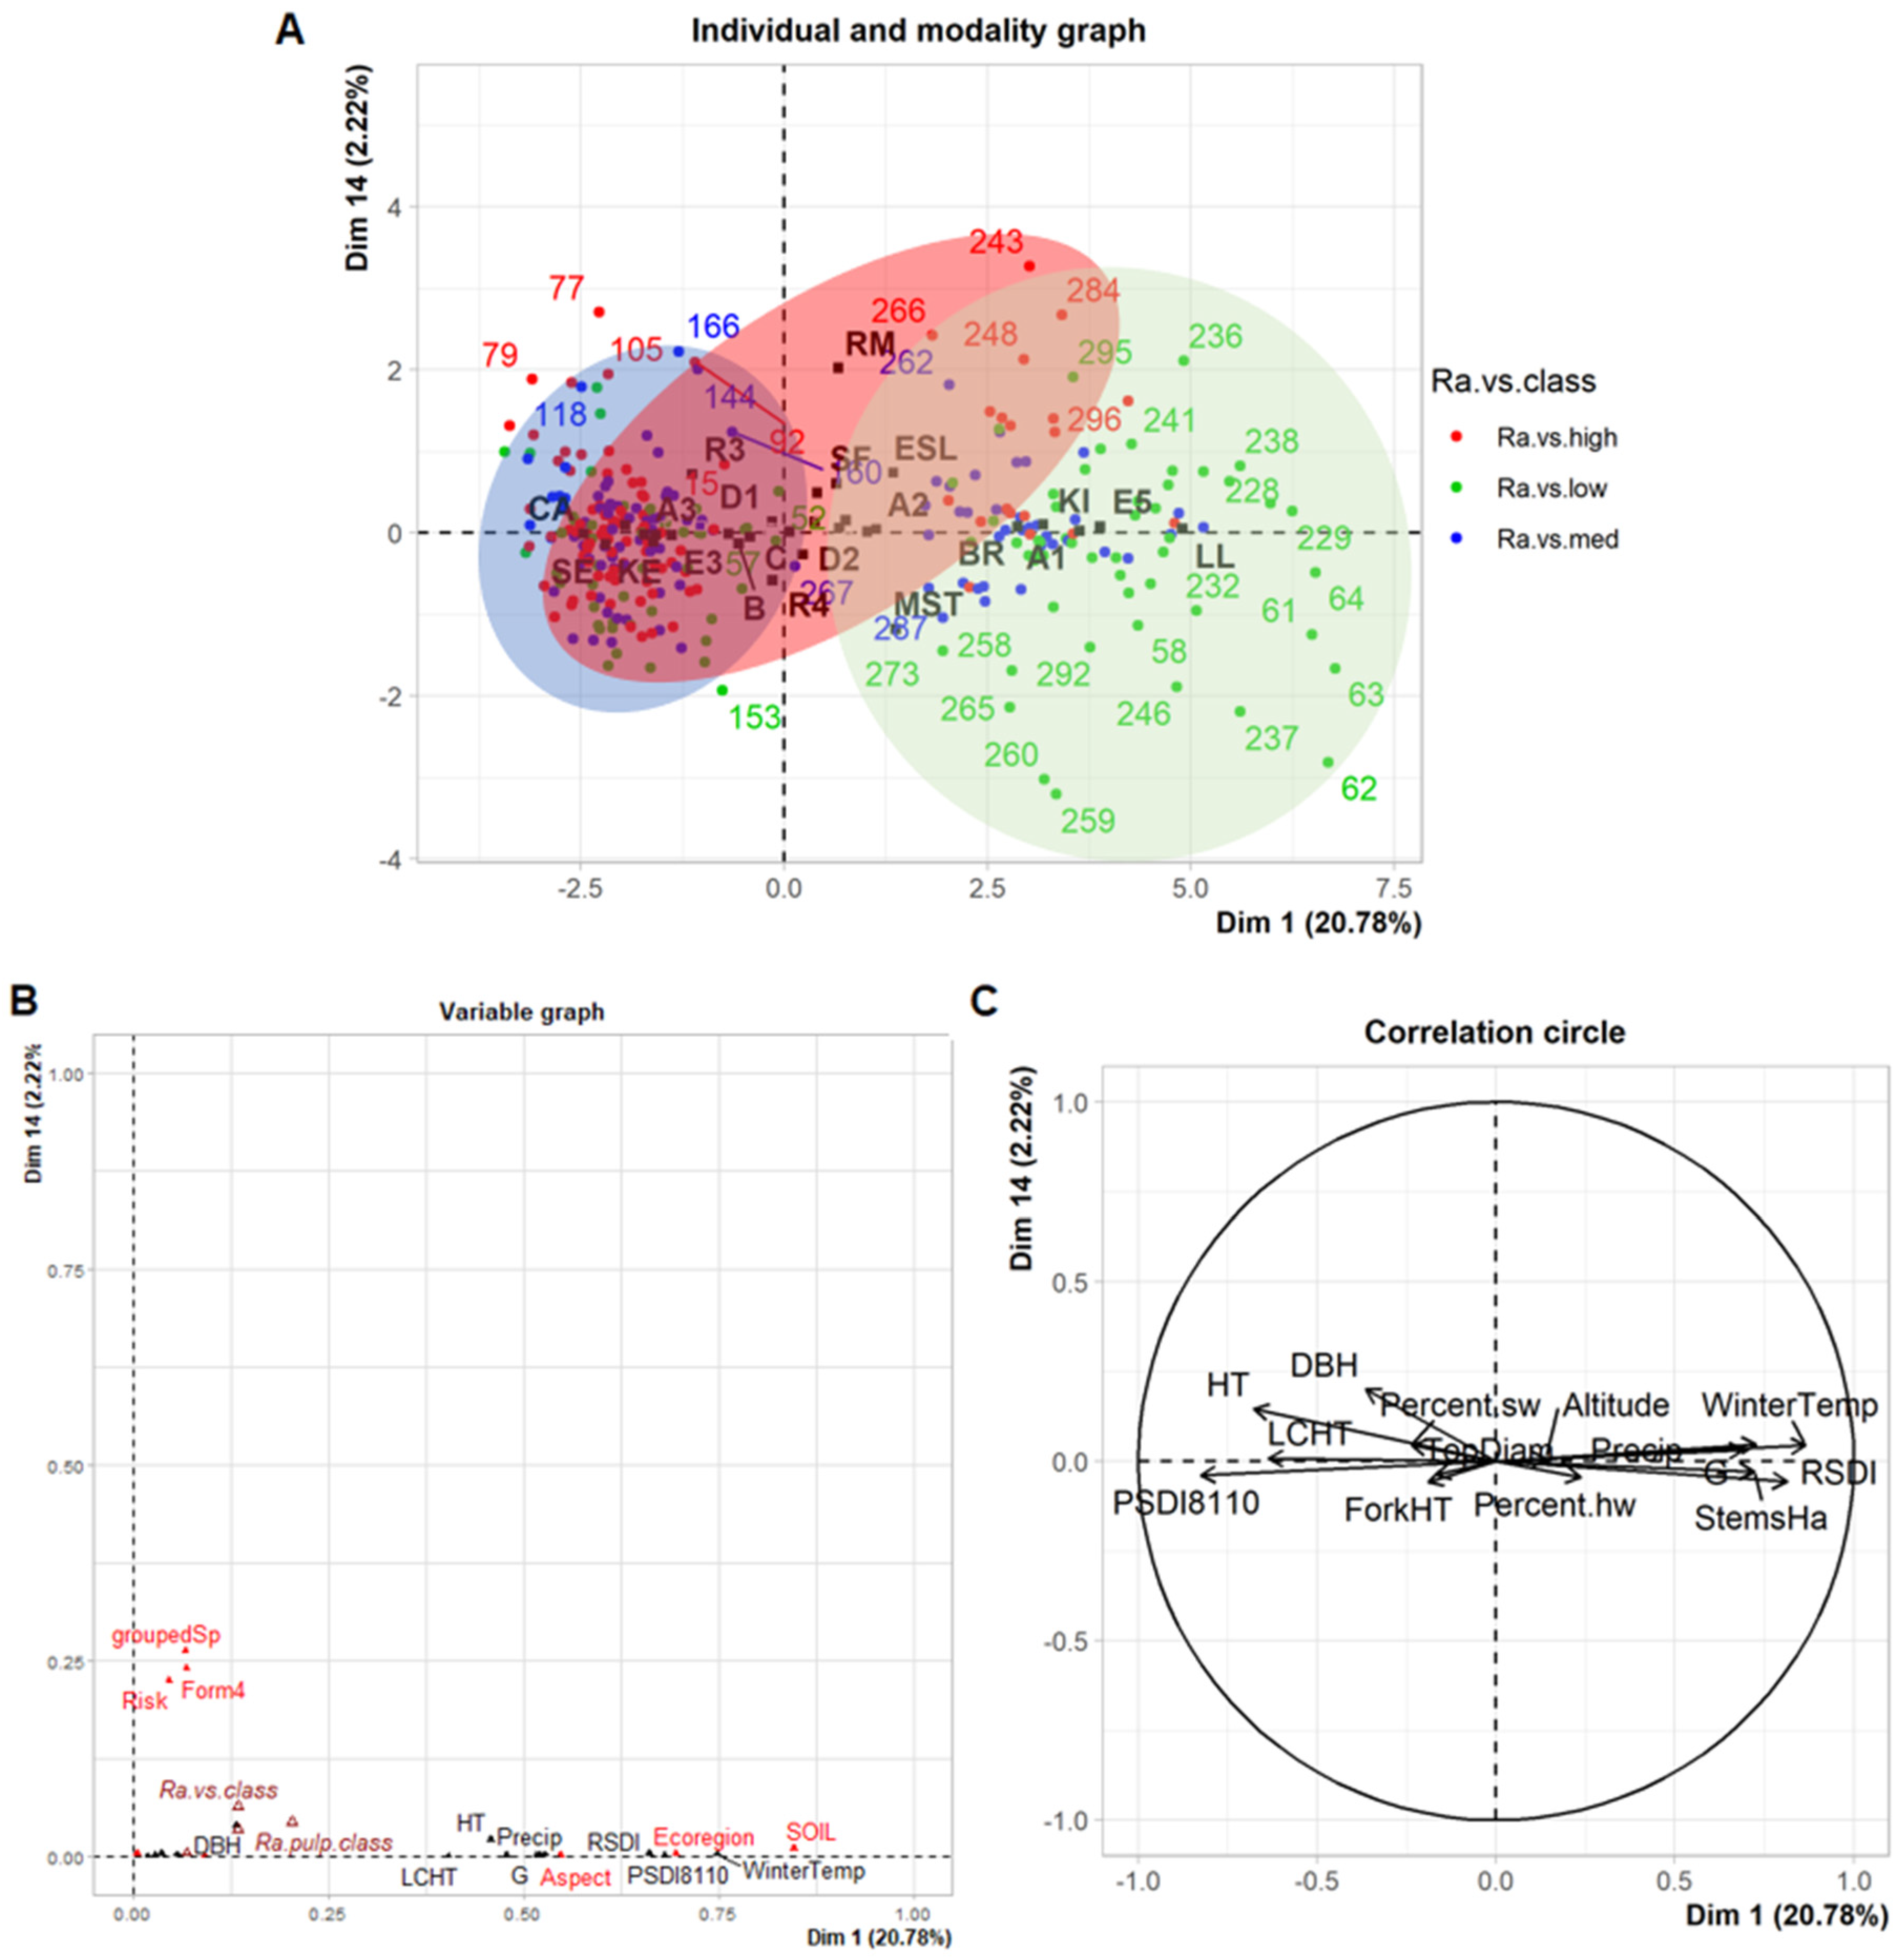
Volume recovery was analyzed with the FAMD for 302 trees of five species groups (sugar maple, red maple, white birch, yellow birch, and other hardwoods). The explained variability of volume recovery reached 90% with 17 dimensions. Dimensions 1 and 2 were the most correlated with the class of efficiency of the total volume, ratio of merchantable volume, and ratio of pulp. Dimensions 1 and 14 showed the highest correlation with the ratio of veneer and sawlogs. Dimension 1 contributed to 20.8% of the explanation of the variability, dimension 2 explained 14.0%, whereas dimension 14 only explained 2.2% of the variability. Variability was explained to 85% with 14 dimensions.
Factors Influencing Merchantable Ratio Recovery
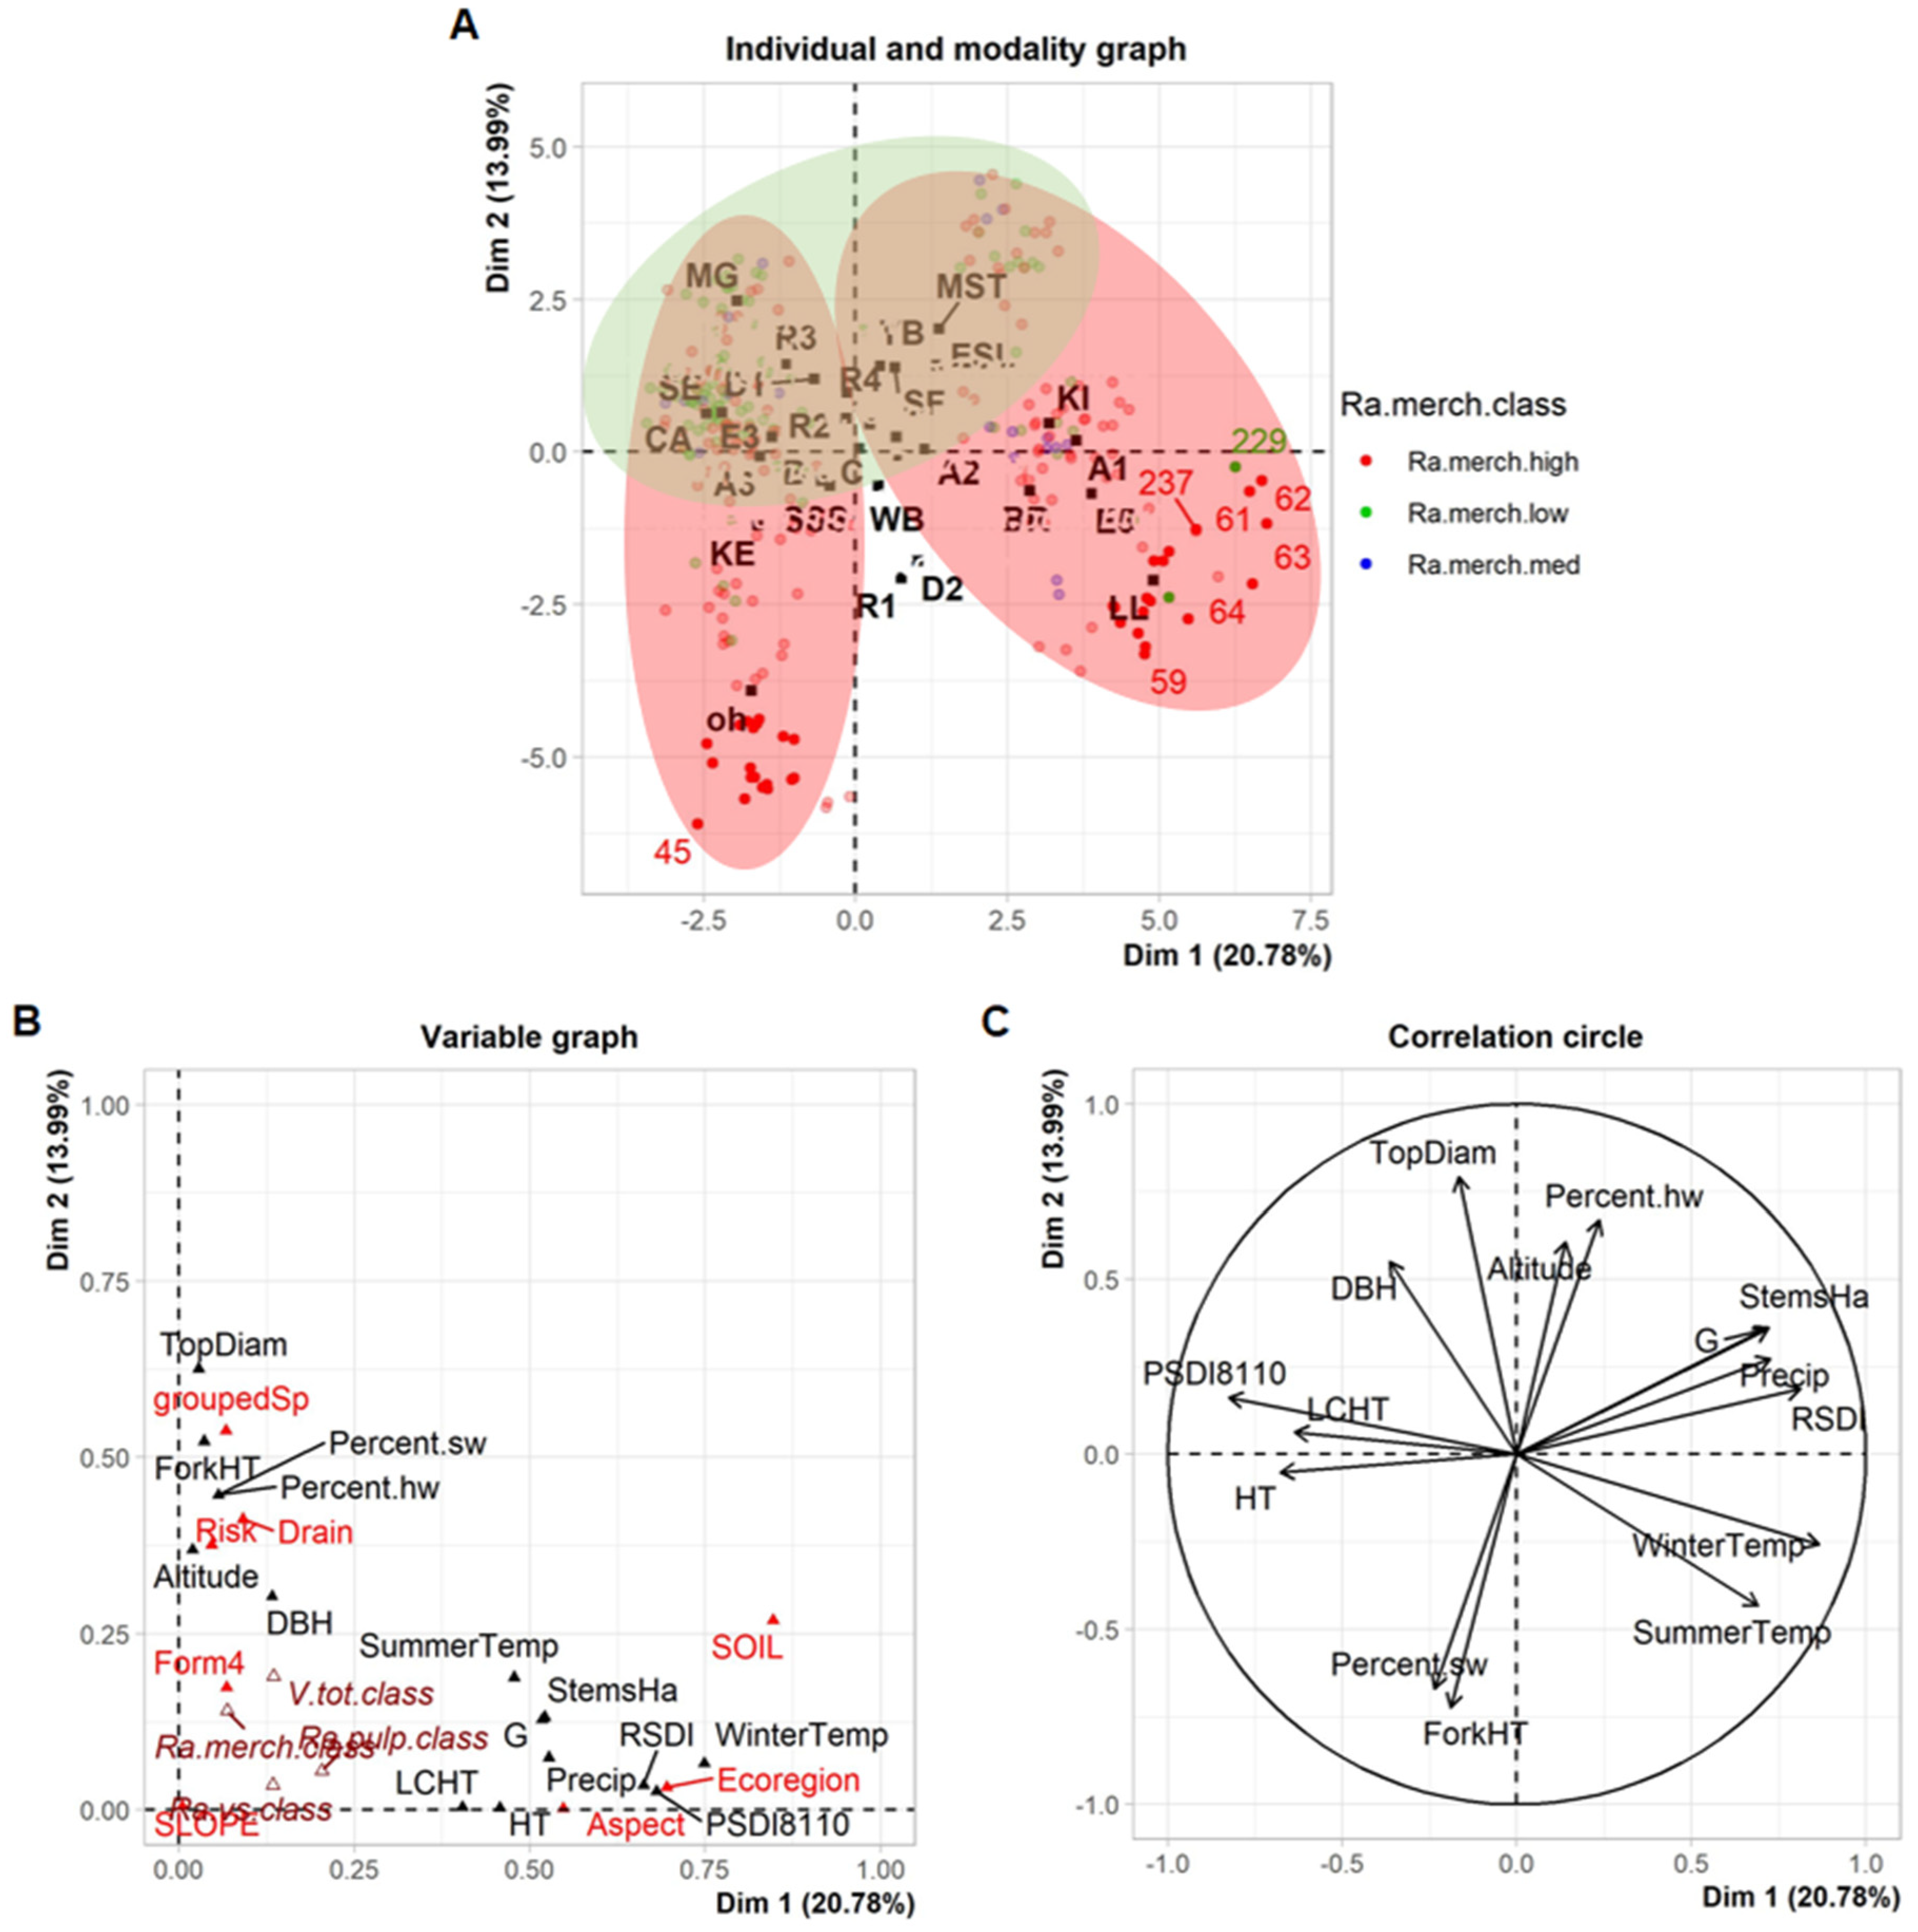
The first dimension was mainly related to soil, winter temperature, ecoregion, the drought index, relative stand density, aspect of the plot, precipitation, and the number of stems per hectare (Figure 12B), with a positive relation for all variables but the drought index (Figure 12C). Tree attributes most affecting this first dimension were total tree height and the height of the living crown, while the DBH had a smaller impact (Figure 12B), with a negative relation with dimension 1 (Figure 12C). Dimension 2 was more related to tree attributes and the most correlated variable was the top diameter of the plot, followed by the height of the fork of trees, and the species group (Figure 12B).
The FAMD showed two groups of trees with a high ratio of merchantable products, on the left and right sides of the plot of the individuals and modalities, both covering the top and bottom halves (Figure 12A). This means that the two groups differed on their attributes associated with dimension 1. Trees from the right group were generally located on stations with high temperatures (summer and winter) and dry conditions (a small PDSI). In terms of dimension, they bared a smaller DBH, shorter heights, and heights of the living crown. Trees from this group were associated with ecoregion 5 and KI and LL soil types, both with a compact till and medium solum and aspects ranging between north-west to north-east and being flat (A1) and therefore colder than other aspects. The group, almost exclusively other hardwoods, with a high ratio of merchantable products, was found on stations with low temperatures in summer and winter, little precipitations, in low altitude with a small part of hardwoods and low densities in the stands (Figure 12A,C). This second group was also associated with ecoregion 3 and SE, CA, KE, and MG soil types, having both compact and non-compact till and mainly medium solum, and aspects A3, indicating south-east to north-east and south-west to north-west, having a moderate temperature. Together, these two groups covered the entire range of observed scores for dimensions 1 and 2; it is therefore difficult to associate high merchantable yields to specific conditions.
In contrast, trees with a low proportion of merchantable products bucked were rather found in the upper half of the scatter plot on both the right and left quadrant (Figure 12A) and showed a clear segregation on dimension 2. This means that low-yield trees were associated with low fork height and high diameter, stands with high top diameter and high percentage of hardwoods, and sites with high altitude.
Factors Influencing Sawlog and Veneer Recovery
Dimensions 1 and 14 were the two most correlated with the ratio of sawlog and veneer over the total tree volume, although the contribution of dimension 14 was very small and the relation with the tree, stand, and site variables was minute. Consequently, the analysis was focused on dimension 1.
There was a clear gradient in sawlog and veneer ratios along dimension 1; higher yields were detected on the left side of the plot of the individuals and modalities (Figure 13A). A low ratio of sawlogs and veneer was reached in ecoregion 5 exhibiting high temperatures, high precipitations, and therefore a low drought index. It was also associated with KI, LL, and BR soil types, having both compact or non-compact till and medium solum, and aspect (A1) indicating north-west to north-east or flat exposition. These stands were dense, and trees had low total heights and low living crown base heights. Conversely, a high-efficiency class tended to be reached in stands with low temperatures, low precipitations, and low stand densities with trees reaching high heights with high crown base heights (Figure 13A,C). A clear distinction between tree species was not observable.
4. Discussion
4.1. Characterization of Forest Plots
The first part of this study provides a portrait of a priori key stand and site variables that are potentially related to hardwood yields, in terms of merchantable and sawlog volumes at the scale of the forest plot. We purposely focused on the characterization of forest plots instead of forest stands, because of the important variability of forest conditions that can typically be found in hardwood stands [27,44].
Six variables were considered in this analysis: species composition, stand density, frequency of form and risk classes, diameter, and height. The analysis was based on five data sources, with two contrasting sample designs: one study was conducted with a systematic distribution of plots, which provided a representative view of the productive forest of New Brunswick (including softwood and mixed wood stands), while the other four were targeted in rather mature hardwood stands. This particularity must be taken in account when reading the results.
Ecoregions [28] were considered as a basis for our analysis where the multivariate analysis allowed a quantitative understanding of the driving climate and soil factors. The analysis showed consistent groups of ecoregions influenced by altitude, soil, temperature, and precipitation. Later analyses showed ecoregions to be significantly influencing all examined plot and tree attributes.
4.1.1. Species Distribution
The productive forest of New Brunswick was characterized by a 30%–70% split in the frequency of hardwood and softwood trees. Among the hardwoods, red maple dominated (9%), followed by sugar maple (7%), white (6%), and yellow birch (5%), followed by other species in smaller proportions. The distribution of tree species depicted in this study was comparable to the values reported in the forest inventory of Atlantic Maritime [45] for the softwood and hardwood distribution. However, percentages for single tree species differed between the abovementioned inventory and this study, likely because of differences in the study areas. In the plots from the studies deliberately targeting hardwood stands, sugar maple and yellow birch dominated, with a smaller proportion of red maple and white birch than for the systematic sampling. The species mix also varied significantly among ecoregions: sugar maple is largely dominant in ecoregion 3 (north-west of the province), while red maple reigns in ecoregions 6 and 7 in the east, and birches (white and yellow) are dominant in Fundy Bay in the South (ecoregion 4). It is difficult at this point to evaluate if these regional differences are caused by site factors (climate and soils) or by the past disturbance history, both natural and anthropogenic [46,47]. Stand age and detailed information about past disturbances, harvests, and treatments were lacking in the databases, which greatly limits this field of investigation.
4.1.2. Stand Density
The stand density is known to affect both stand- and tree-level wood production; high density generally leads to smaller diameter trees with longer boles clear of branches for a given stand age [48]. The relative stand density index (RDSI) developed by Ducey and Knapp [30] for mixed forest stands was used as a measure of density and inter-tree competition. On average, the studied stands reached 63% of maximum density; the distribution of the stand density was comparable among all ecoregions for both sampling types, to the exception of stands from non-systematic sampling in ecoregion 5, which bear significantly higher densities. This difference remains yet unexplained.
4.1.3. Form and Risk Classes
Form and risk classes developed in New Brunswick are routinely used for stand assessment and silviculture prescriptions in tolerant hardwoods, showing a significant relation with merchantable and sawlog yields [21]. Single straight stems (SSS) were dominating in frequency in both sample types (70% for systematic and 52% for non-systematic sampling). The occurrence of trees with an optimal tree form (single straight stem) depended on several factors. The share of these trees was comparable to observations by Castle et al. [21] for red maple and yellow birch. The high number of trees having a single straight stem (SSS) are positive for the wood industry, as bucking of straight stems is easier and increases the harvesting productivity [49]. It is, however, necessary to mention that trees exhibiting single straight stems are more easily identifiable in the field, thus possibly triggering more classification errors for more complex tree forms.
More than two thirds of trees inventoried had risk classes 1 or 2. This result suggests that either the probability of risk-causing agents is weak and the consequent mortality is very low or low and a stable evolution of value of products in the stem is expected [32], or these agents are causing a rapid death of the trees, leaving a small number of trees for the record.
The influence of the RSDI of plots was significant both on form and risk classification but it was more pronounced for form as compared to risk. The form of trees, which is partly driven by the presence or absence of large branches on the stem, is known to be influenced by the stand density [50,51]. However, in our study, the assumption that tree quality is better with higher density does not hold in most of the interactions when involving form groups.
The trees in the hardwood-dominated stands generally presented better form and health in the systematic plots than in the other sample type. An explanation of this may lie in the difference in the age distribution between the two sampling groups: trees in the systematic sampling tend to be smaller in DBH, which suggests that they are younger than the trees from other sampled plots, mostly mature stands ready for harvest. It is reasonable to hypothesize that form and health decreases as stand ages. The proportion of form and risk classes varied with the interaction of ecoregion, sample type, hardwood or softwood dominance, and tree species, with no outstanding patterns.
4.1.4. Diameter and Height
Species showed different ranges of DBHs across ecoregions, with an obvious trend of higher overall values in trees located in mature plots as compared to those selected systematically. We did not find such differences for height. The range of the DBH measured was higher in most of the ecoregions, both in sugar maple and yellow birch. Sugar maple diameters in ecoregion 4 were smaller than in the other ecoregions, possibly linked to the presence of rocky soils with low fertility [28], which limit growth and quality [52]. In terms of height, no ecoregion stood out for yellow birch, whereas sugar maple tended to be taller in ecoregions 1 and 7. Overall, sugar maple tends to be higher than other species.
However, the effects of site and stand variables on diameter and height are difficult to interpret without some knowledge on stand age and disturbance history. When considering form and risk classes to DBH or height, clear trends could not be observed.
4.2. Product Recovery
The first analysis at product level was based on the occurrence of different product types according to the total volume generated per tree. The 3712 logs measured were mainly classified as pulp, with only one fourth being veneer or sawlogs. The proportion of unutilized logs was overall low (2.2%–16.1%), with greater shares in hardwoods, especially when bucking sugar maple and yellow birch.
The multivariate analysis did not allow to segregate trees with high and low ratios of merchantable volume, on the basis of site, stand, or tree attributes. Some conditions were more associated with trees with a lower proportion of merchantable volume, but they were totally overlapped by those associated with trees with a high ratio.
Conversely, the multivariate analysis was successful at identifying conditions associated with high quality log yields. Veneer and sawlog ratios were correlated more strongly to environmental factors and stand properties than to tree attributes. A high recovery of veneer and sawlogs was found to be strongly linked to sites with low temperatures in summer and winter, as well as low drought occurrence. Furthermore, high veneer and sawlog yields were associated with SE and KE soil types both located in north-western New Brunswick. These finding supports the conclusion on the importance of environmental variable on veneer and sawlog recovery as previously shown by Hassegawa et al. [22] and Guillemette and Bédard [23]. The absence of relationships with site variables observed by Castle et al. [21] in a study area similar to ours is likely an artifact caused by the application of general linear modeling with collinear predictors, as hypothesized in the introduction.
Higher sawlog and veneer yields were also linked with low stand densities, as measured with the RSDI and the number of trees per hectare. This seems to contradict the hypothesis about the positive effect of the stand density on stem quality. A possible explanation is that in our sample of trees, high stand densities may be associated with younger stands, with high stem counts and small trees, many of them too small to bear sawlogs or veneers. However, the lack of information on stand age did not allow us to test this assumption.
In comparison to the other factors, the correlations between sawlog and veneer recovery with tree attributes are weaker. Total tree height and the height of the living crown were the most significant and showed a stronger link to veneer and sawlog recovery than the form classes, as pointed by Castle et al. [21]. The weak correlation with form classes suggests that, overall, tree inclination, bole straightness, or the presence of multiple stems or multiple forks have a smaller importance on the proportion of veneer and sawlog, in comparison to the length of the branch-free bole. Contrary to Hassegawa et al. [22], our study did not allow us to make a distinction between sawlog and veneer recovery of sugar maple and yellow birch, based on site, stand, and tree attributes.
This contrasts with the results from Fortin et al. [20] who predicted the volume by log grades using a tree quality grade as predictor: in this case, the tree grading system was using criteria similar that the ones used for the log grading system, which likely explain the quality of the statistical relationship. The reader should notice that the later log grading system, designed by Petro and Calvert [53], is mostly based on the assessment of length of the branch-free bole.
Results from the analysis of the ratios of veneer and sawlogs to total volume indicated that environmental factors have a stronger influence on product recovery as compared to the tested tree attributes. This may allow a classification of Acadian forests into areas with an expected high output of merchantable volume, particularly concerning veneer and sawlogs, following the idea of “hot spots” proposed by Hassegawa et al. [22] for the province of Québec. Such a distinction between areas may also allow the concentration of forest operations and silvicultural investments in regions where high value recovery is expected. In regions with less favorable environmental factors, stand improvement treatments should be considered to promote trees of particularly good quality, thus maximizing their dimensions.
4.3. Methodological Limitations
Data were provided from several field campaigns with various protocols and field crews. It is conceivable that the inherent methodological differences influenced some of the inventory results, for example form and risk classification, in comparison to more controlled studies.
At product level, the ratio of different product types depending on total volume bucked for each tree was generated. This ratio was undoubtedly sensitive to different product classification and company specifications as well as to individual performance of harvesting operators. We hoped that the possible bias through product classification could be reduced by the creation of product groups. The influence of harvesting operators could not be quantified. Finally, databases including assessment on product recovery were limited to ecoregions 3 and 5, therefore not permitting extrapolating beyond these ecoregions.
4.4. Opportunities for Further Studies
This study did not include any historical data on forest management and natural disturbances. These are known to impact different variables examined in this article, such as species abundance [47,54], or growth trends and risk of mortality [55]. Historical data also seem to have an impact on value recovery of hardwood species [22], thereby allowing for a more refined analysis concerning product recovery. In the same direction, the assessment of factors influencing the form and risk classification may allow more detailed conclusions on factors influencing risk classification such as presence of fungus, competition, or structural weaknesses [32].
Several datasets were assessed in limited ecoregions (data sources D and M for example), thus limiting their explanatory potential to other ecoregions. Even though the study on products was limited to a small area of Acadian forests in ecoregions 3 and 5, environmental factors remained prominent in the prediction of volume recovery. The inclusion of future product studies from all ecoregions may provide new information on possible regional differences.
Every bucking decision in hardwoods rests with the operator, a facet not considered in this project, and yet it strongly influences the performance of the operation [56] and likely the recovery of sawlogs and veneer. This topic should be addressed in upcoming research.
5. Conclusions
Our study aimed at characterizing the distribution of tree, stand, and site attributes and assessing their influence on the recovery of merchantable, sawlog, and veneer volumes in Acadian forests.
First, site factors, summarized by ecoregions, had a significant influence on the species composition, stand densities, form and risk classes, diameters, and heights of trees. Second, the recovery of the merchantable volume of veneer and sawlogs was highly influenced by certain site attributes such as the soil type, summer and winter temperatures, and annual precipitation. Tree attributes such as form or risk class played a smaller role for the sawlog and veneer recovery but should not be discounted as they are also especially useful for silvicultural and operational decision making. This paper confirms that incorporating tree, stand, and site attributes in planning could enhance the predictability of forest operations and product recovery in northern hardwood stands.
Supplementary Materials
The following supporting information can be downloaded at: https://www.mdpi.com/article/10.3390/f14020182/s1, Figure S1: Decision tree for form classification of trees used in New Brunswick [29]; Table S1: List of variables included in the FAMD on ecoregions; Table S2: ANOVA table (type II) for multinomial analysis of tree species (N = 253,235); Table S3: ANOVA table of relative stand density index (RSDI); Table S4: ANOVA table (type II) for form classes; Table S5: ANOVA table (type II) for risk classes; Table S6: ANOVA table for DBH of trees with known localization (N = 253,235); Table S7: ANOVA table for DBH of trees with information on form group and risk class (N = 25,516); Table S8: ANOVA of tree height depending on species group, plot dominance, and ecoregion (N = 62,292); Table S9: ANOVA table of tree height depending on form group and risk class (N = 24,048).
Author Contributions
Conceptualization, C.B., E.R.L. and J.-M.L.; methodology, C.B., E.R.L. and J.-M.L.; formal analysis, C.B.; data curation, C.B.; writing—original draft preparation, C.B.; writing—review and editing, E.R.L. and J.-M.L.; visualization, C.B.; supervision, E.R.L. and J.-M.L.; project administration, E.R.L. and J.-M.L.; funding acquisition, E.R.L. All authors have read and agreed to the published version of the manuscript.
Funding
Funding for this study was generously provided by Mitacs Canada (grant number IT18574) with the Northern Hardwoods Research Institute (NHRI) as project partner and co-funder as well as the University Laval.
Data Availability Statement
The data used in this work is not openly available because of underlying data sharing restrictions imposed by the creators of the databases.
Acknowledgments
The authors want to acknowledge the institutions who provided the databases used for this study. Specifically, we are grateful to the NHRI and Chris Hennigar from the New Brunswick Department of Natural Resources and Energy Development (NBDNRED). Special thanks are due to Gaetan Pelletier, Executive Director of the NHRI, for his assistance throughout the project as well as Pamela Hurley-Poitras for continued support regarding data acquisition. The authors are grateful for the field work conducted by all teams involved in the field campaigns and wish to thank Nicolas Pelletier from Natural Resources Canada for his extraction of environmental data used in this article.
Conflicts of Interest
The authors declare no conflict of interest.
References
- Drouin, M.; Beauregard, R.; Duchesne, I. Impact of Paper Birch (Betula Papyrifera) Tree Characteristics on Lumber Color, Grade Recovery, and Lumber Value. For. Prod. J. 2010, 60, 236–243. [Google Scholar] [CrossRef]
- Shmulsky, R.; Jones, P.D. Forest Products and Wood Science: An Introduction, 7th ed.; Wiley Blackwell: Hoboken, NJ, USA, 2011; ISBN 978-0-8138-2074-3. [Google Scholar]
- Millet, J. L’architecture des Arbres des Régions Tempérées: Son Histoire, Ses Concepts, Ses Usages; Éditions MultiMondes: Québec, QC, Canada, 2012; ISBN 978-2-89544-190-8. [Google Scholar]
- NBDNRED. Management Alternatives for New Brunswick’s Public Forest—Report of the New Brunswick Task Force on Forest Diversity and Wood Supply. 2008. Available online: https://www2.gnb.ca/content/dam/gnb/Departments/nr-rn/pdf/en/ForestsCrownLands/Erdle/ErdleReport-e.pdf (accessed on 8 December 2022).
- Moreau, E.; Bédard, S.; Moreau, G.; Pothier, D. Relationships between Tree Vigor Indices and a Tree Classification System Based upon Apparent Stem Defects in Northern Hardwood Stands. Forests 2018, 9, 588. [Google Scholar] [CrossRef] [Green Version]
- Havreljuk, F.; Achim, A.; Pothier, D. Predicting Lumber Grade Occurrence and Volume in Sugar Maple and Yellow Birch Logs. For. Sci. 2022, 68, 410–424. [Google Scholar] [CrossRef]
- MFFP. Les Produits et Sous-Produits Du Bois. Available online: https://mffp.gouv.qc.ca/forets/echo-foret/octobre2000/savoir/produits.htm (accessed on 4 August 2021).
- Pickens, J.B.; Lee, A.; Lyon, G.W. Optimal Bucking of Northern Hardwoods. North. J. Appl. For. 1992, 9, 149–152. [Google Scholar] [CrossRef]
- Spinelli, R.; Magagnotti, N.; Labelle, E.R. The Effect of New Silvicultural Trends on the Mental Workload of Harvester Operators. Croat. J. For. Eng. 2020, 41, 177–190. [Google Scholar] [CrossRef] [Green Version]
- Cutter, B.E.; Coggeshall, M.V.; Phelps, J.E.; Stokke, D.D. Impacts of Forest Management Activities on Selected Hardwood Wood Quality Attributes: A Review. Wood Fiber Sci. 2004, 36, 84–97. [Google Scholar]
- Cockwell, M.; Caspersen, J. Sources of Variation in the Net Value of Sugar Maple Trees: Implications for Tree Selection and Operations Management. For. Prod. J. 2014, 64, 250–258. [Google Scholar] [CrossRef]
- Southern New Brunswick Forest Product Marketing Board (Ed.) Hardwood Sawlog, Veneer & Spoolwood Prices and Specs; Southern New Brunswick Forest Product Marketing Board: Lower Cove, NB, Canada, 2022. [Google Scholar]
- Canada’s National Forest Inventory (Ed.). Table 14.1. Area (1000 Ha) of Forest Land by Species Group, Age Class and Terrestrial Ecozone in Canada. 2013. Available online: https://nfi.nfis.org/resources/general/summaries/t0/en/NFI/html/NFI_T14_LSAGE20_AREA_en.html (accessed on 29 November 2022).
- Leak, W.B.; Yamasaki, M.; Holleran, R. Silvicultural Guide for Northern Hardwoods in the Northeast; U.S. Department of Agriculture, Forest Service, Northern Research Station: Newtown Square, PA, USA, 2014; p. NRS-GTR-132.
- Loo, J.; Ives, N. The Acadian Forest: Historical Condition and Human Impacts. For. Chron. 2003, 79, 462–474. [Google Scholar] [CrossRef]
- Mosseler, A.; Lynds, J.A.; Major, J.E. Old-Growth Forests of the Acadian Forest Region. Environ. Rev. 2003, 11, S47–S77. [Google Scholar] [CrossRef] [Green Version]
- Simons-Legaard, E.; Legaard, K.; Weiskittel, A. Projecting Complex Interactions between Forest Harvest and Succession in the Northern Acadian Forest Region. Ecol. Model. 2021, 456, 109657. [Google Scholar] [CrossRef]
- Statistics Canada. Table 14-10-0202-01 (Formerly CANSIM 281-0024): Employment by Industry, Annual. Available online: https://cfs.nrcan.gc.ca/statsprofile/employment/NB (accessed on 8 December 2022).
- NB Forest Products Commission (Ed.) Timber Utilization Report 2020–2021. 2021. Available online: https://nbfpc-cpfnb.ca/content/dam/nbfpc-cpfnb/pdf/timber-utilization-utilisation-bois/timber-utilization-report-2020-21.pdf (accessed on 8 December 2022).
- Fortin, M.; Guillemette, F.; Bédard, S. Predicting Volumes by Log Grades in Standing Sugar Maple and Yellow Birch Trees in Southern Québec, Canada. Can. J. For. Res. 2009, 39, 1928–1938. [Google Scholar] [CrossRef]
- Castle, M.; Weiskittel, A.; Wagner, R.; Ducey, M.; Frank, J.; Pelletier, G. Variation in Stem Form and Risk of Four Commercially Important Hardwood Species in the Acadian Forest: Implications for Potential Sawlog Volume and Tree Classification Systems. Can. J. For. Res. 2017, 47, 1457–1467. [Google Scholar] [CrossRef]
- Hassegawa, M.; Havreljuk, F.; Ouimet, R.; Auty, D.; Pothier, D.; Achim, A. Large-Scale Variations in Lumber Value Recovery of Yellow Birch and Sugar Maple in Quebec, Canada. PLoS ONE 2015, 10, e0136674. [Google Scholar] [CrossRef] [PubMed] [Green Version]
- Guillemette, F.; Bédard, S. Potential for Sugar Maple to Provide High-Quality Sawlog Trees at the Northern Edge of Its Range. For. Sci. 2019, 65, 411–419. [Google Scholar] [CrossRef]
- Graham, M.H. Confronting Multicollinearity in Ecological Multiple Regression. Ecology 2003, 84, 2809–2815. [Google Scholar] [CrossRef] [Green Version]
- Government of NB (Ed.) About NB—Geography. Available online: https://www2.gnb.ca/content/gnb/en/gateways/about_nb/geography.html (accessed on 8 December 2022).
- NBDNRED. New Brunswick Forests. Available online: https://www2.gnb.ca/content/dam/gnb/Departments/nr-rn/pdf/en/ForestsCrownLands/GNBForestryBrochure_EN.pdf (accessed on 17 November 2022).
- Labelle, E.R.; Pelletier, G.; Soucy, M. Developing and Field Testing a Tool Designed to Operationalize a Multitreatment Approach in Hardwood-Dominated Stands in Eastern Canada. Forests 2018, 9, 485. [Google Scholar] [CrossRef] [Green Version]
- Zelazny, V.; Martin, G.; Toner, M.; Colpitts, M.; Veen, H.; Godin, B.; McInnis, B.; Steeves, C.; Roberts, M. Our Landscape Heritage: The Story of Ecological Land Classification in New Brunswick; NBDNRED: Fredericton, NB, Canada, 2007. [Google Scholar]
- Labelle, E.R.; Jaeger, D. Soil Compaction Caused by Cut-to-Length Forest Operations and Possible Short-Term Natural Rehabilitation of Soil Density. Soil Sci. Soc. Am. J. 2011, 75, 2314–2329. [Google Scholar] [CrossRef] [Green Version]
- Ducey, M.J.; Knapp, R.A. A Stand Density Index for Complex Mixed Species Forests in the Northeastern United States. For. Ecol. Manag. 2010, 260, 1613–1622. [Google Scholar] [CrossRef]
- Piqué, M.; Obon, B.; Condés, S.; Saura, S. Comparison of Relascope and Fixed-Radius Plots for the Estimation of Forest Stand Variables in Northeast Spain: An Inventory Simulation Approach. Eur. J. For. Res. 2011, 130, 851–859. [Google Scholar] [CrossRef]
- Pelletier, G.; Landry, D.; Girouard, M. A Tree Classification System for New Brunswick; NHRI: Edmundston, NB, Canada, 2020; p. 65. [Google Scholar]
- Hurley Poitras, P. Timber Project 2020 Activity; NHRI: Edmundston, NB, Canada, 2020. [Google Scholar]
- Thornton, M.M.; Shrestha, R.; Wei, Y.; Thornton, P.E.; Kao, S.; Wilson, B.E. Daymet: Daily Surface Weather Data on a 1-Km Grid for North America, Version 4; ORNL DAAC: Oak Ridge, TN, USA, 2020. [Google Scholar] [CrossRef]
- Murphy, P.N.C.; Ogilvie, J.; Connor, K.; Arp, P.A. Mapping Wetlands: A Comparison of Two Different Approaches for New Brunswick, Canada. Wetlands 2007, 27, 846–854. [Google Scholar] [CrossRef]
- Wang, Y.; Hogg, E.H.; Price, D.T.; Edwards, J.; Williamson, T. Past and Projected Future Changes in Moisture Conditions in the Canadian Boreal Forest. For. Chron. 2014, 90, 678–691. [Google Scholar] [CrossRef] [Green Version]
- Powell, G.R.; Beardmore, T. New Brunswick Tree and Shrub Species of Concern: A Field Guide; Natural Resources Canada, Canadian Forest Service, Atlantic Forestry Centre: Fredericton, NB, Canada, 2002; Information Report M-X-212E; 66p. [Google Scholar]
- Pretzsch, H.; Biber, P. A Re-Evaluation of Reineke’s Rule and Stand Density Index. For. Sci. 2005, 51, 304–320. [Google Scholar]
- Markwardt, L.J. Comparative Strength Properties of Woods Grown in the United States; Technical Bulletin; United States Department of Agriculture: Washington, DC, USA, 1930.
- Kershaw, J.A.; Ducey, M.J.; Beers, T.W.; Husch, B. Forest Mensuration, 5th ed.; Wiley Blackwell: Chichester, UK, 2017; ISBN 978-1-118-90203-5. [Google Scholar]
- Kuhn, M. Caret: Classification and Regression Training—R Package Version 6.0-90. Available online: https://CRAN.R-project.org/package=caret (accessed on 5 December 2022).
- Vaissie, P.; Monge, A.; Husson, F. Factoshiny: Perform Factorial Analysis from “FactoMineR” with a Shiny Application—R Package Version 2.4. 2021. Available online: https://CRAN.R-project.org/package=Factoshiny (accessed on 13 December 2022).
- Husson, F.; Lê, S.; Pagès, J. Exploratory Multivariate Analysis by Example Using R; Chapman & Hall/CRC Computer Science and Data Analysis; CRC Press: Boca Raton, FL, USA, 2011; ISBN 978-1-4398-3580-7. [Google Scholar]
- Lussier, J.-M.; Meek, P. Managing Heterogeneous Stands Using a Multiple-Treatment Irregular Shelterwood Method. J. For. 2014, 112, 287–295. [Google Scholar] [CrossRef] [Green Version]
- Government of Canada. Forest Inventory Atlantic Maritime—Statistical Data. Available online: https://scf.rncan.gc.ca/statsprofile/inventory/maritimedealtlantique (accessed on 16 December 2022).
- Kenefic, L.S.; Sendak, P.E.; Brissette, J.C. Comparison of Fixed Diameter-Limit and Selection Cutting in Northern Conifers. North. J. Appl. For. 2005, 22, 77–84. [Google Scholar] [CrossRef] [Green Version]
- Neuendorff, J.K.; Nagel, L.M.; Webster, C.R.; Janowiak, M.K. Stand Structure and Composition in a Northern Hardwood Forest after 40 Years of Single-Tree Selection. North. J. Appl. For. 2007, 24, 197–202. [Google Scholar] [CrossRef] [Green Version]
- Assmann, E. The Principles of Forest Yield Study; Pergamon Press Ltd.: Oxford, UK, 1970; ISBN 978-0-08-006658-5. [Google Scholar]
- Labelle, E.R.; Soucy, M.; Cyr, A.; Pelletier, G. Effect of Tree Form on Productivity of a Cut-to-Length Harvester in a Hardwood Dominated Stand. Croat. J. For. Eng. 2016, 37, 175–183. [Google Scholar]
- Sonderman, D.L. Stand Density—A Factor Affecting Stem Quality of Young Hardwoods; Research Paper NE; U.S. Department of Agriculture, Forest Service, Northeastern Forest Experiment Station: Newtown Square, PA, USA, 1985.
- Jozsa, L.A.; Middleton, G.R. A Discussion of Wood Quality Attributes and Their Practical Implications; Special Publication; Forintek Canada Corp: Vancouver, BC, Canada, 1994; p. 51. [Google Scholar]
- MRNQ (Ed.) Le Guide Sylvicole du Québec—Les Fondements Biologiques de la Sylviculture—Tome 1; LES PUBLICATIONS DU QUEBEC: Québec, QC, Canada, 2013; ISBN 978-2-551-25232-9. [Google Scholar]
- Petro, F.J.; Calvert, W.W. La Classification des Billes de Bois Franc Destinées au Sciage; Rapport Technique de Foresterie; Service Canadien des Forêts, Ministère des Pêches et de l’Environnement: Ottawa, ON, Canada, 1976; ISBN 978-0-662-01105-7. [Google Scholar]
- McClure, J.W.; Lee, T.D. Small-Scale Disturbance in a Northern Hardwoods Forest: Effects on Tree Species Abundance and Distribution. Can. J. For. Res. 1993, 23, 1347–1360. [Google Scholar] [CrossRef]
- Moreau, G.; Achim, A.; Pothier, D. A Dendrochronological Reconstruction of Sugar Maple Growth and Mortality Dynamics in Partially Cut Northern Hardwood Forests. For. Ecol. Manag. 2019, 437, 17–26. [Google Scholar] [CrossRef]
- Häggström, C.; Lindroos, O. Human, Technology, Organization and Environment—A Human Factors Perspective on Performance in Forest Harvesting. Int. J. For. Eng. 2016, 27, 67–78. [Google Scholar] [CrossRef]
Figure 1.
Location of the study area in Eastern Canada with the identification of the seven ecoregions.
Figure 1.
Location of the study area in Eastern Canada with the identification of the seven ecoregions.

Figure 2.
Relationships analyzed at plot and tree level.

Figure 3.
Individual factor map (A), variable graph (B), and correlation circle (C) for FAMD on ecoregions. Explanation of variables can be found in Table S1.
Figure 3.
Individual factor map (A), variable graph (B), and correlation circle (C) for FAMD on ecoregions. Explanation of variables can be found in Table S1.

Figure 4.
Species distribution (SM: sugar maple; RM: red maple; WB: white birch; YB: yellow birch; oh: other hardwoods; sw: softwoods) depending on sampling type (systematic “syst” and other) (A) and ecoregion (1 to 7) and plot dominance (hardwood dominated (“hw.dom”) or softwood dominated (“sw.dom”)) and (B), N = 253,235.

Figure 5.
Relative stand density index of plots depending on the ecoregion (1 to 7) and the sample type (systematic “syst” or other) (N = 6789). Different letters indicate statistically different RSDI’s based on Tukey-HSD post hoc tests.
Figure 5.
Relative stand density index of plots depending on the ecoregion (1 to 7) and the sample type (systematic “syst” or other) (N = 6789). Different letters indicate statistically different RSDI’s based on Tukey-HSD post hoc tests.

Figure 6.
Form group of trees (N = 25,560) depending on plot dominance (hardwood dominated (“hw.dom”) or softwood dominated (“sw.dom”)) and sample type (systematic “syst” or other) (A), plot dominance and grouped species (SM: sugar maple; RM: red maple; WB: white birch; YB: yellow birch; oh: other hardwoods; sw: softwoods) (B), sample type and species group (C), sample type and stand density (RSDI) (D), RSDI and species group (E), RSDI and ecoregion (F), and ecoregion and grouped species (G). Form groups are single straight stem (SSS), extensive sweep or lean (ESL), multiple stems (MST) and significant fork (SF).

Figure 7.
Risk class of trees (R1–R4) (N = 25 516) depending on plot dominance (hardwood dominated (“hw.dom”) or softwood dominated (“sw.dom”) and sample type (systematic “syst” or “other”) (A), plot dominance and grouped species (SM: sugar maple; RM: red maple; WB: white birch; YB: yellow birch; oh: other hardwoods; sw: softwoods) (B), sample type and species group (C), sample type and ecoregion (D), plot dominance and ecoregion (E), sample type and stand density (RSDI) (F), RSDI and species group (G), RSDI and ecoregion (H), species group and ecoregion (I).

Figure 8.
DBH of trees (N = 253,235) depending on species group (SM: sugar maple; RM: red maple; WB: white birch; YB: yellow birch; oh: other hardwoods; sw: softwoods) and ecoregions (1 to 7) (A), species group and plot dominance (hardwood dominated (“hw.dom”) or softwood dominated (“sw.dom”)) (B), ecoregion and plot dominance (C), sample type (systematic “syst” or other) and species group (D), and sample type and plot dominance (E). Outliers have been removed from graphical representation to enhance readability of results.

Figure 9.
DBH (cm) depending on form group (SSS: single straight stem, ESL: extensive sweep or lean, MST: multiple stems, SF: significant fork) and risk class (R1–R4) (N = 25,516). Different letters indicate statistically different DBH’s between risk groups based on Tukey-HSD post hoc tests.
Figure 9.
DBH (cm) depending on form group (SSS: single straight stem, ESL: extensive sweep or lean, MST: multiple stems, SF: significant fork) and risk class (R1–R4) (N = 25,516). Different letters indicate statistically different DBH’s between risk groups based on Tukey-HSD post hoc tests.

Figure 10.
Tree height (N = 62,292) depending on species (SM: sugar maple; RM: red maple; WB: white birch; YB: yellow birch; oh: other hardwoods; sw: softwoods) and ecoregion (1 to 7) (A), plot dominance (hardwood dominated (“hw.dom”) or softwood dominated (“sw.dom”)) and grouped species (B) and plot dominance and ecoregion (C).

Figure 11.
Tree height (m) depending on form group (SSS: single straight stem, ESL: extensive sweep or lean, MST: multiple stems and SF: significant fork).and risk class (R1–R4) (N = 24,048). Different letters indicate statistically different heights between risk classes based on Tukey-HSD post hoc tests.

Figure 12.
Individuals and modality graph (A), variable graph (B), and correlation circle (C) of FAMD on 302 trees bearing products having environmental data. In graphic A, only individuals and modalities with a contribution of greater than or equal to 0.5 are labeled, coloration depending on merchantable/total volume ratio.

Figure 13.
Individuals and modality graph (A), variable graph (B), and correlation circle (C) of FAMD on 302 trees bearing products and having environmental data. In graphic A, coloration depending on the (sawlogs + veneer)/total volume ratio.
Figure 13.
Individuals and modality graph (A), variable graph (B), and correlation circle (C) of FAMD on 302 trees bearing products and having environmental data. In graphic A, coloration depending on the (sawlogs + veneer)/total volume ratio.


Table 1.
Overview of different data sources used for this study.
| Data Source ID | C | D | M | N | P |
|---|---|---|---|---|---|
| Study objective | Continuous land use inventory | Pre- and post-harvest inventory to investigate operations | Hardwood product characterization study | Experimental silviculture and inventory plots | Pre- and post-harvest inventory to develop models for volume recovery |
| Provider | NBDNRED | NHRI | NHRI | NHRI | NBDNRED |
| Data acquisition years | 2019–2020 | 2020–2021 | 2013–2014 | 2012–2020 | 2018–2021 |
| Target forest population | All forest land of New Brunswick | Mature stands | Mature hardwood-dominated stands | Mature hardwood stands | Mature hardwood stands |
| Sampling design | Systematic grid of plots across the province | Systematic plots in 1 ha frames located in operational blocks | Random selection of trees located in operational blocks | Random or systematic plots located in operational blocks | Systematic plots in 1 ha operational blocks |
| Sample type | Systematic | Other | Other | Other | Other |
| Sample plot type | Fixed radius plot | Variable radius plot | n/a | Both fixed and variables radius plots | Variable radius plot |
| Number of plots | 6597 | 171 | n/a | 2369 | 96 |
| Number of trees before computation | 250,876 | 1217 | 660 | 35,470 | 859 |
| Plot location known | Yes | Yes | No | No | Yes |
| Measures of products | No | Yes, for a subset of trees | Yes | No | Yes |
| Bucking technique | n/a | CTL | Both full tree and CTL | n/a | CTL |
Table 2.
Overview of number of observations for different variables for trees and logs measured.
| Measured Object | Variables | Total Number of Trees | Number of Trees with Localization |
|---|---|---|---|
| Tree | Species, DBH | 287,984 | 253,235 |
| Form class | 42,356 | 25,560 | |
| Risk class | 42,322 | 25,516 | |
| Tree height | 72,897 | 62,292 | |
| Logs | Species, DBH, height, form and risk class | 743 | 252 |
| dominance of tree, height of living crown, fork height | 391 | 252 |
Table 3.
Risk classes of trees according to tree form and risk classification [32].
Table 3.
Risk classes of trees according to tree form and risk classification [32].
| Risk Classes | Probability of Mortality | Evolution of Monetary Value over Time | Probability of Product Downgrade | Defects |
|---|---|---|---|---|
| R1 | Very low | Increase | Low | No presence or only minor defects |
| R2 | Low | Stable | Moderate | Moderate defects present |
| R3 | Moderate | Decrease | High | Presence of moderate defects significantly affecting the vigor |
| R4 | High | Decrease | High | Presence of major defects |
Table 4.
Environmental variables used for analysis.
| Variable | Unit | Source |
|---|---|---|
| Soil, aspect, drainage, and slope | Categories | EFI |
| Altitude | m | DEM NB |
| Wet area mapping | m | GeoNB |
| Degree days, degree days zero-degree, degree days five-degree | °C | Daymet V4 |
| Degree days during vegetation period | °C | Daymet V4 |
| Mean annual temperature | °C | Daymet V4 |
| Mean maximum and mean minimum temperature | °C | Daymet V4 |
| Mean annual precipitation | mm | Daymet V4 |
| Shortwave radiating flux density | W/m² | Daymet V4 |
| Annual precipitation | mm | Canadian Forest Service |
| Palmer Drought Severity Index (PSDI) | n/a | Canadian Forest Service |
| Summer and winter temperatures | °C | Canadian Forest Service |
Table 5.
Form categories built from form classes.
| New form Categories | Original form Class(es) | |
|---|---|---|
| SSS | Single straight stem | F1 |
| ESL | Extensive sweep or lean | F2 F6 |
| MST | Multiple stems | F5 F8 |
| SF | Significant fork | F3 F4 F7 |
Table 6.
Count and percentage of products bucked depending on species group (SM: sugar maple; RM: red maple; WB: white birch; YB: yellow birch; oh: other hardwoods; sw: softwoods) and product class.
Table 6.
Count and percentage of products bucked depending on species group (SM: sugar maple; RM: red maple; WB: white birch; YB: yellow birch; oh: other hardwoods; sw: softwoods) and product class.
| Veneer.saw | Pulp | Unutilized | Total | |||||
|---|---|---|---|---|---|---|---|---|
| N | % | N | % | N | % | N | % | |
| SM | 478 | 27.8 | 1012 | 58.9 | 229 | 13.3 | 1719 | 100 |
| RM | 84 | 13.5 | 477 | 76.9 | 59 | 9.5 | 620 | 100 |
| WB | 9 | 14.5 | 50 | 80.6 | 3 | 4.8 | 62 | 100 |
| YB | 175 | 19.1 | 593 | 64.8 | 147 | 16.1 | 915 | 100 |
| oh | 76 | 40.9 | 106 | 57.0 | 4 | 2.2 | 186 | 100 |
| sw | 124 | 59.0 | 77 | 36.7 | 9 | 4.3 | 210 | 100 |
| Total | 946 | 25.5 | 2315 | 62.4 | 451 | 12.1 | 3712 | 100 |
Disclaimer/Publisher’s Note: The statements, opinions and data contained in all publications are solely those of the individual author(s) and contributor(s) and not of MDPI and/or the editor(s). MDPI and/or the editor(s) disclaim responsibility for any injury to people or property resulting from any ideas, methods, instructions or products referred to in the content. |
© 2023 by the authors. Licensee MDPI, Basel, Switzerland. This article is an open access article distributed under the terms and conditions of the Creative Commons Attribution (CC BY) license (https://creativecommons.org/licenses/by/4.0/).
Share and Cite
MDPI and ACS Style
Bennemann, C.; Labelle, E.R.; Lussier, J.-M. Influence of Tree, Stand, and Site Attributes on Hardwood Product Yield: Insights into the Acadian Forests. Forests 2023, 14, 182. https://doi.org/10.3390/f14020182
AMA Style
Bennemann C, Labelle ER, Lussier J-M. Influence of Tree, Stand, and Site Attributes on Hardwood Product Yield: Insights into the Acadian Forests. Forests. 2023; 14(2):182. https://doi.org/10.3390/f14020182
Chicago/Turabian StyleBennemann, Caroline, Eric R. Labelle, and Jean-Martin Lussier. 2023. "Influence of Tree, Stand, and Site Attributes on Hardwood Product Yield: Insights into the Acadian Forests" Forests 14, no. 2: 182. https://doi.org/10.3390/f14020182
Note that from the first issue of 2016, this journal uses article numbers instead of page numbers. See further details here.